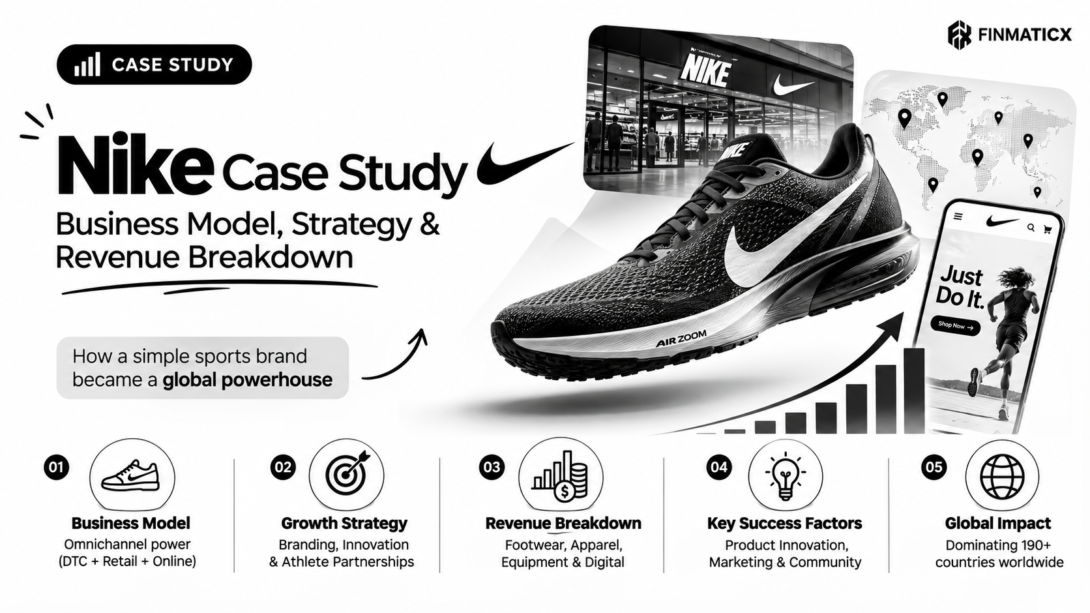
Few companies get studied in business schools as often as Nike. It built one of the most recognizable brands on earth, invented the modern athlete-endorsement playbook, and generated over $46 billion in revenue in fiscal 2026 alone. And yet, over the past two years, Nike had to publicly admit that a core piece of its own strategy had stopped working — and reverse course in front of investors, analysts, and every business journalist covering the sportswear industry.
That reversal is what makes this Nike case study worth reading closely, whether you’re a marketing student, an equity analyst, or a founder studying how billion-dollar brands actually make decisions. This isn’t a surface-level “Nike is a great brand” overview. It’s a detailed breakdown of Nike’s business model, its exact revenue streams, how those streams shifted over the past three fiscal years, and what its current turnaround strategy looks like in the numbers — all sourced from Nike’s own SEC filings, quarterly earnings releases, and its FY2026 Annual Report to Shareholders (Form ARS), filed with the SEC.
Executive Summary
Nike, Inc. is the world’s largest designer, marketer, and distributor of athletic footwear, apparel, and equipment, generating $46.4 billion in revenue in fiscal year 2026 (ended May 31, 2026). Its business model rests on two primary distribution channels — wholesale and NIKE Direct (owned retail and digital) — supplemented by its Converse subsidiary and brand licensing revenue.
The central story of this case study is a strategic overcorrection and its reversal. Between the early 2020s and fiscal 2025, Nike aggressively shifted resources toward direct-to-consumer (DTC) sales, pulling back from wholesale partners to capture higher margins and richer customer data. That bet coincided with a steep 10% revenue decline in fiscal 2025. Under CEO Elliott Hill, who returned to Nike in 2024 specifically to lead a turnaround, the company spent fiscal 2026 deliberately rebuilding the wholesale relationships it had spent years distancing itself from — and it worked well enough that wholesale revenue grew for the year while NIKE Direct and Converse both declined.
Company History and Timeline
Understanding Nike’s current strategy requires understanding where the company came from. Here’s the abbreviated timeline:
- 1964 — Phil Knight and his University of Oregon track coach, Bill Bowerman, found Blue Ribbon Sports, initially distributing Japanese running shoes from Onitsuka Tiger in the United States.
- 1971 — The company rebrands as Nike, Inc., named after the Greek goddess of victory, and adopts the now-iconic “Swoosh” logo, designed by graphic design student Carolyn Davidson.
- 1980 — Nike goes public on the New York Stock Exchange under the ticker NKE.
- 1984 — Nike signs a rookie basketball player named Michael Jordan, laying the groundwork for what would become the Jordan Brand — now one of Nike’s most valuable sub-brands.
- 2003 — Nike acquires Converse, the maker of Chuck Taylor All Stars, expanding beyond performance athletics into athletic lifestyle footwear.
- 2010s–early 2020s — Nike pursues an aggressive direct-to-consumer strategy, investing heavily in Nike.com, the Nike app, and SNKRS, while pulling back from a number of wholesale retail partners.
- 2024 — Elliott Hill, a Nike veteran who had previously served as President of Consumer and Marketplace before retiring in 2020, returns as President and CEO to lead a company-wide turnaround.
- FY2025 (ended May 2025) — Full-year revenue falls approximately 10% year-over-year, with steep declines across NIKE Direct, wholesale, and Converse.
- FY2026 (ended May 2026) — Full-year revenue stabilizes at $46.4 billion, roughly flat versus the prior year, with wholesale returning to growth for the first time in years while NIKE Direct and Converse continue to decline.
Nike’s Business Model, Explained
At its core, Nike’s business model is straightforward: design in-demand product, outsource manufacturing to independent contract factories, and sell through a mix of retail partners and Nike’s own channels. What makes this case study genuinely interesting isn’t the model itself — it’s how aggressively Nike has rebalanced the mix between those channels in response to changing consumer behavior, and how costly it can be to get that balance wrong.
Nike does not manufacture its own products. It focuses internal resources on three things: product design and innovation, brand marketing (including its well-known athlete endorsement deals), and distribution strategy. That third piece — distribution strategy — is where most of the material in this case study comes from, because it’s the lever Nike has pulled hardest on over the last five years.
Nike organizes its internal reporting around four geographic operating segments for the NIKE Brand — North America; Europe, Middle East & Africa (EMEA); Greater China; and Asia Pacific & Latin America (APLA) — plus Converse as a separate reportable segment. Each geographic segment covers the design, marketing, and sale of Nike and Jordan Brand products in that region.
Revenue Streams: Where Nike’s Money Comes From
| Revenue Stream | FY2026 (year ended 5/31/26) | FY2025 (year ended 5/31/25) | Change |
|---|---|---|---|
| Wholesale | $27.5 billion | $25.9 billion | +6% reported, +4% currency-neutral |
| NIKE Direct | $17.7 billion | $18.8 billion | -6% reported, -8% currency-neutral |
| NIKE Brand total | $45.2 billion | $44.7 billion | +1% reported, -1% currency-neutral |
| Converse | $1.2 billion | $1.7 billion | -31% reported |
| NIKE, Inc. total | $46.4 billion | $46.3 billion | Flat reported, -2% currency-neutral |
Wholesale distribution is Nike’s oldest channel and, as of fiscal 2026, its fastest-growing one again. Nike sells in bulk to footwear stores, sporting goods retailers, athletic specialty shops, and department stores, which then resell to consumers at a markup. Wholesale growth in FY2026 was driven primarily by North America, and Nike specifically highlighted that Foot Locker posted positive revenue and retail sales comps for the first time in four years — a meaningful signal that the wholesale relationship rebuild is translating into results for partners, not just for Nike.
NIKE Direct covers Nike-owned retail stores, factory outlet stores, Nike.com, and the Nike mobile app. It was Nike’s fastest-growing channel for most of the last decade, until the trend reversed. In FY2026, NIKE Direct revenue fell to $17.7 billion, with NIKE Brand Digital sales (Nike.com and the app) dropping to $8.6 billion from $9.6 billion the year prior — a decline Nike attributed primarily to reduced traffic. NIKE-owned store sales held closer to flat at $9.1 billion, though comparable store sales still fell 4%.
Converse, a wholly owned subsidiary since 2003, runs its own wholesale and direct sales for Chuck Taylor, All Star, One Star, and other trademarks. It’s currently the weakest-performing piece of the portfolio, with full-year FY2026 revenue down 31% to $1.2 billion, driven by declines across all territories.
Licensing and Global Brand Divisions revenue comes from third parties licensed to manufacture certain Nike-branded products, plus other miscellaneous brand revenue that isn’t tied to a specific geography. It’s small relative to the other three streams, but stable.
Revenue by Geography
Nike’s four NIKE Brand geographic segments perform very differently, and that divergence is central to understanding the current case study. Here’s the full-year FY2026 breakdown:
| Segment | FY2026 Revenue | % of NIKE Brand Revenue |
|---|---|---|
| North America | $20.51 billion | 45.4% |
| Europe, Middle East & Africa (EMEA) | $12.57 billion | 27.8% |
| Greater China | $5.85 billion | 12.9% |
| Asia Pacific & Latin America (APLA) | $6.24 billion | 13.8% |
North America is doing the heavy lifting in the turnaround: it grew in the fourth quarter, powered by wholesale strength and continued momentum in Nike Running. Greater China tells the opposite story — Q4 FY2026 revenue there fell 17% as Nike executes what management has called a comprehensive marketplace reset, and EMEA declined roughly 6% in the same quarter amid elevated inventory levels and a heavier mix of lifestyle “Sportswear” product, which has been in decline industry-wide.
Revenue by Product Category
Beyond channel and geography, Nike also reports revenue by product line. Footwear remains by far the largest category: NIKE Brand footwear revenue was $29.5 billion in both FY2026 and FY2025, effectively flat, with growth in North America offsetting declines in Greater China. Apparel and equipment make up the remainder, with apparel historically contributing under a third of NIKE Brand revenue and equipment a small single-digit share.
Within footwear specifically, Nike has been deliberately shifting its mix away from “classic” lifestyle franchises and toward performance categories. Management disclosed that it pulled more than $2 billion out of classic footwear franchises during fiscal 2026 alone, in a direct effort to reduce promotional intensity and reset how those products show up in the marketplace. Nike Running has been the standout beneficiary of that reallocation, posting five consecutive quarters of double-digit growth and adding roughly $1 billion to the running business over that stretch.
The Jordan Brand, meanwhile, has grown into a business large enough to be treated almost as its own case study within Nike. Jordan Brand revenue has been reported in the range of $4.7–5.2 billion in recent years, representing more than 10% of Nike’s total revenue on its own — though even Jordan has faced headwinds recently, with continued erosion in Jordan streetwear product noted in fiscal 2026 results.
Marketing and Demand Creation Strategy
Nike doesn’t call its marketing budget “marketing” in its financial filings — it calls it “demand creation expense,” and the distinction matters. Demand creation expense consists of two pieces: brand marketing expense (advertising, production and media costs, digital marketing, brand events, and retail brand presentation) and sports marketing expense (endorsement contracts, complimentary product, and sports marketing events).
Here’s how that spending has trended over the past three fiscal years:
| Fiscal Year | Demand Creation Expense | Change |
|---|---|---|
| FY2024 | $4.285 billion | — |
| FY2025 | $4.689 billion | +9% |
| FY2026 | $4.754 billion | +1% |
This is the line item that funds Nike’s athlete endorsement network — the mechanism behind its famous “Just Do It” campaigns and sport-first storytelling — and it’s a deliberate lever in the current turnaround. Fiscal 2026 saw higher sports marketing expense specifically, even as overall demand creation growth slowed, reflecting management’s stated shift back toward sport-first marketing and away from broader lifestyle brand campaigns. Total selling and administrative expense (demand creation plus operating overhead) came to $16.1 billion in FY2026, or 34.7% of total revenue.
Manufacturing and Supply Chain Model
Nike does not own or operate the factories that make its products. Like most of the sportswear industry, it designs footwear, apparel, and equipment in-house and then contracts with independent manufacturers, primarily located in Vietnam, China, and Indonesia, to produce them. This asset-light manufacturing model keeps Nike’s balance sheet lean and lets it scale production up or down with demand, but it also exposes the company to supply chain risk, labor-practice scrutiny, and — as fiscal 2026 demonstrated directly — tariff policy.
That last point isn’t theoretical. Nike’s fourth-quarter FY2026 gross margin jumped 890 basis points to 49.2%, and a large chunk of that increase — reported at roughly $986 million — came from an expected recovery of tariffs paid under the International Emergency Economic Powers Act (IEEPA). It’s a vivid illustration of how directly global trade policy can move the bottom line for a company with Nike’s manufacturing footprint.
On the workforce side, third-party workforce intelligence data puts Nike’s global headcount at roughly 73,600 employees as of March 2026, down from about 75,800 a year earlier and down nearly 13% from 2023 — a decline consistent with the wage-related severance costs Nike itself disclosed in its FY2026 operating overhead expense.
Case Study: The Direct-to-Consumer Bet That Backfired
This is the part of the Nike case study most worth studying closely, because it’s a case study in strategic overcorrection as much as it is in retail economics.
For much of the 2010s and early 2020s, Nike pursued an aggressive direct-to-consumer strategy — pulling back from wholesale partners, cutting off some retail accounts entirely, and pushing customers toward its own stores and app instead. The logic made sense on paper: owning the customer relationship meant higher margins per sale, richer first-party data on shopper behavior, and less reliance on third parties who might also be selling competitors’ products right next to Nike’s.
The strategy worked for a while. Then it stalled. NIKE Direct revenue began contracting, digital sales fell sharply in some quarters, and overall company revenue dropped roughly 10% in fiscal 2025 — a steep decline for a company of Nike’s size and maturity. Pulling back from wholesale partners had also created space for competitors to fill Nike’s old shelf space in stores like Foot Locker and Dick’s Sporting Goods, ceding both sales and brand visibility Nike would later have to fight to win back.
Fiscal 2026 marks the case study’s turning point. Wholesale revenue grew about 4% on a currency-neutral basis for the full year — outpacing NIKE Direct for the first time in years — as new leadership under CEO Elliott Hill deliberately rebuilt the wholesale relationships the company had spent the better part of a decade distancing itself from. It’s a genuinely useful example of how even a company that pioneered digital-first, direct-to-consumer retail can be forced to recalibrate once that strategy stops paying off — a theme worth understanding if you’re also tracking how AI tools are reshaping business and content strategy more broadly, since the underlying lesson (don’t over-rotate on any single channel, even a high-margin one) applies well beyond retail.
Nike’s FY2026 Financial Performance, Line by Line
Nike reported full-year fiscal 2026 revenue of $46.4 billion, flat on a reported basis and down about 2% on a currency-neutral basis — a genuine stabilization after the prior year’s roughly 10% decline. Full-year net income came to $3.1 billion, down 3% year-over-year, with diluted earnings per share of $2.10, also down 3%.
Fourth-quarter results tell a more dramatic story. Revenue for the quarter was $10.97 billion, down 1% year-over-year but ahead of Wall Street’s consensus expectation of roughly $10.86 billion. Fourth-quarter net income jumped 407% year-over-year to $1.1 billion, and diluted EPS came in at $0.72 — but $0.52 of that per-share figure was directly attributable to the one-time IEEPA tariff-refund benefit described above. Strip that out, and adjusted fourth-quarter EPS was $0.20, roughly in line with analyst expectations of $0.13–0.20 depending on the estimate used.
Looking ahead, Nike’s own guidance calls for first-quarter fiscal 2027 revenue to decline in the low-to-mid single digits, with a further deceleration expected in the second quarter due to tougher year-over-year comparisons, while gross margin expansion is expected to resume starting in the first quarter of fiscal 2027.
Nike’s Turnaround Strategy: “Win Now” and “Sport Offense”
Nike’s leadership has used two related but distinct terms to describe its turnaround. “Win Now” refers to the near-term tactical priorities Hill’s team set out to execute during fiscal 2025 and 2026 — realigning internal teams, strengthening wholesale partner relationships, rebalancing the product portfolio away from over-promoted classic franchises, and “winning on the ground” market by market. “Sport Offense” is the broader strategic framework layered on top of that: a return to sport-first storytelling, performance product, and rebuilt marketplace relationships, after several years of prioritizing lifestyle products and direct-to-consumer economics.
Concretely, this has shown up as:
- Rebuilding wholesale partnerships and refreshing more than 15,000 retail spaces worldwide
- Pulling over $2 billion out of classic, overexposed footwear franchises to reduce discounting and promotional intensity
- Doubling down on performance categories — Nike Running has posted five consecutive quarters of double-digit growth
- Re-investing in athlete storytelling and marquee sport moments within brand marketing
- Gaining market share in statement running footwear across North America and Western Europe
Risks and Challenges Ahead
No case study is complete without an honest look at what could go wrong. Nike’s own disclosures point to several live risks heading into fiscal 2027:
- Greater China remains a genuine problem. Fourth-quarter revenue there fell 17% amid what management calls a comprehensive marketplace reset, and it’s the one major geography without a clear turnaround narrative yet.
- The Sportswear (lifestyle) category is still shrinking, both for Nike and for retail sales more broadly, and EMEA in particular is carrying elevated inventory tied to that mix.
- Tariff policy is now a material swing factor, not a footnote — the fourth-quarter results make that explicit, and any change in IEEPA tariff treatment could move gross margin materially in either direction going forward.
- Guidance points to near-term softness, with management itself forecasting declining revenue in the first half of fiscal 2027 before an expected recovery in gross margin.
SWOT Analysis
| Strengths | Weaknesses |
|---|---|
| Dominant global brand recognition and athlete partnerships | Heavy reliance on Greater China, currently underperforming |
| Diversified channel mix (wholesale + direct + Converse + licensing) | Recent NIKE Direct and Converse declines |
| Strong performance-category momentum (Running, football) | Exposure to tariffs and global supply chain costs |
| Opportunities | Threats |
|---|---|
| Rebuilding wholesale relationships to regain lost shelf space | Intensifying competition from Adidas, On, Hoka, and others |
| Growing the Jordan Brand as an independent growth driver | Continued softness in the broader Sportswear/lifestyle category |
| Membership and app-based engagement (Nike Run Club, Training Club) | Currency and macroeconomic headwinds outside the U.S. |
Nike vs. Adidas vs. Under Armour
| Company | Primary Revenue Model | Core Distribution Mix |
|---|---|---|
| Nike | Wholesale + direct-to-consumer product sales, plus licensing | Wholesale-led again, with a large owned retail/digital layer |
| Adidas | Wholesale + direct-to-consumer product sales, plus licensing | Similar mix, historically more wholesale-weighted in some regions |
| Under Armour | Wholesale + direct-to-consumer product sales | Smaller scale, heavier reliance on North American wholesale |
The underlying model across the sportswear industry is largely the same: design product, manufacture through contracted factories, and sell through a mix of wholesale partners and owned retail. Nike’s scale, marketing spend, and athlete endorsement network are what separate it from competitors running a similar playbook — though as this case study shows, even that scale doesn’t make Nike immune to getting its channel strategy wrong, or to the multi-year cost of correcting it.
Key Takeaways From This Nike Case Study
- Nike’s business model rests on two channels — wholesale and NIKE Direct — plus smaller Converse and licensing revenue, organized around four geographic segments.
- A multi-year push into direct-to-consumer eroded wholesale relationships and coincided with a steep ~10% fiscal 2025 revenue decline.
- Fiscal 2026 shows a genuine strategic reversal: wholesale grew roughly 4-6% while NIKE Direct declined 6-8% and Converse fell 31%.
- Demand creation (marketing) spend grew to $4.75 billion in FY2026, with a deliberate shift toward sports marketing and sport-first storytelling under the “Sport Offense” framework.
- Nike pulled over $2 billion out of overexposed classic footwear franchises in FY2026 to reduce discounting and reset the marketplace.
- Headline profit numbers can be misleading — Q4 FY2026’s 407% net income jump was driven mostly by a one-time ~$986 million tariff-refund benefit, not core operating improvement.
- Greater China remains the clearest unsolved problem in the turnaround, with Q4 revenue there down 17%.
Case Study Discussion Questions
For students or teams using this as a working case study, these are the questions worth debating:
- Was Nike’s original direct-to-consumer push a strategic mistake, or a reasonable bet that was simply executed too aggressively and for too long?
- What signals should have told Nike’s leadership earlier that the wholesale pullback was ceding ground to competitors?
- How should a company weigh the higher margins of direct-to-consumer sales against the reach and lower operating costs of wholesale distribution?
- Given that Nike’s Q4 FY2026 profit jump was driven mostly by a one-time tariff benefit, what does the “real” underlying trajectory of the turnaround look like once that’s excluded?
- What would a credible fix for Nike’s Greater China business need to include, given that region hasn’t responded to the same playbook that’s working in North America?
FAQ
What is this Nike case study mainly about? It’s about how Nike balances two core distribution channels — wholesale and direct-to-consumer — and how a multi-year overcorrection toward direct-to-consumer forced the company into a wholesale-focused turnaround starting in fiscal 2026.
What caused Nike’s recent slowdown? A combination of factors: a pullback from wholesale partners that ceded shelf space to competitors, weaker digital sales within NIKE Direct due to reduced traffic, softness in the Sportswear/lifestyle category, and continued underperformance in Greater China.
Is Nike’s turnaround working? Early signs are mixed but improving. Full-year fiscal 2026 revenue stabilized at $46.4 billion after a steep prior-year decline, wholesale returned to growth, and Nike Running posted five straight quarters of double-digit growth, even as NIKE Direct, Converse, and Greater China all remained under pressure.
What is Nike’s “Sport Offense” strategy? It’s the broader strategic framework behind CEO Elliott Hill’s turnaround, emphasizing sport-first product and marketing, rebuilt wholesale relationships, and renewed investment in performance categories over lifestyle-driven direct-to-consumer growth. “Win Now” refers to the more tactical, near-term execution priorities within that framework.
How much does Nike spend on marketing? Nike’s “demand creation expense” — which covers both brand marketing and sports/athlete marketing — was $4.754 billion in fiscal 2026, up 1% from $4.689 billion in fiscal 2025.
Where does Nike manufacture its products? Nike doesn’t own factories. It contracts with independent manufacturers, primarily in Vietnam, China, and Indonesia, to produce its footwear, apparel, and equipment.
Where can I read Nike’s own financial disclosures? Nike publishes its quarterly and annual results through its investor relations site, and its full 10-K and Annual Report to Shareholders filings are available on the SEC’s EDGAR database.
If you found this level of detail useful, it’s the same approach we take across Finmaticx’s business case study coverage — grounded in primary filings rather than secondhand summaries. And if you’re curious how AI-assisted research tools helped pull together the multi-year financial trend data in this piece, our breakdown of Finmaticx GPT explains the workflow.