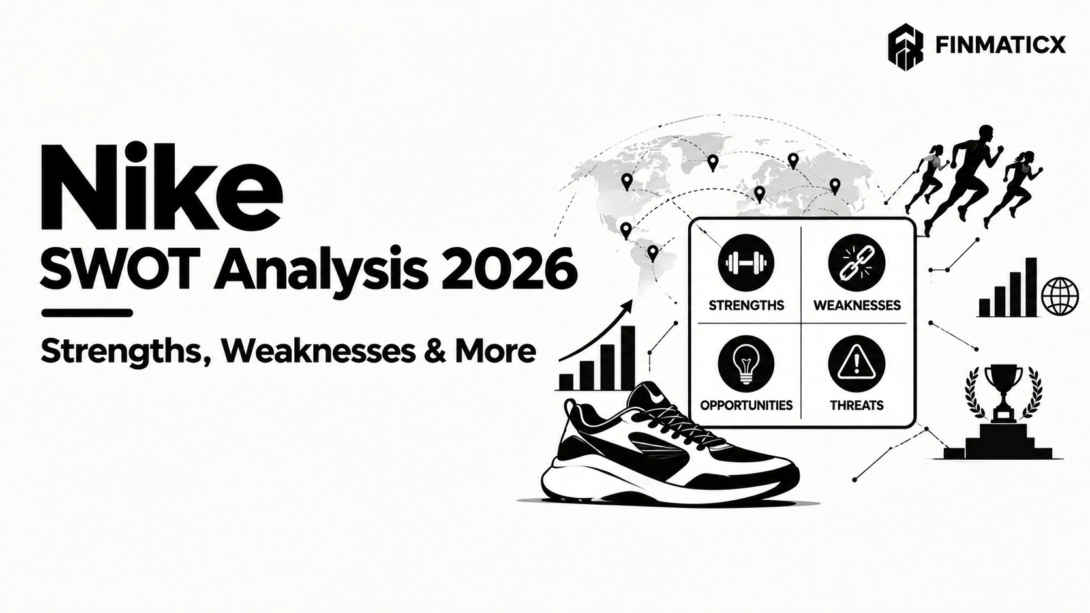
A Nike SWOT analysis used to be an easy assignment: dominant brand, huge scale, best athletes, and a few risks to list at the bottom. In October 2026 it is much harder, because Nike is doing two very different things at once.
On one hand, its performance business is growing and now generates about $16 billion a year. On the other, on October 1 Nike reported first-quarter revenue down 4%, told investors to expect a high-single-digit revenue decline for fiscal 2027, and announced a new multi-year restructuring program called Pace, with layoffs planned from 2027. Its CFO told analysts that results were below both the company’s expectations and its potential.
So which story is the real Nike? Both. This guide breaks down the Nike SWOT analysis factor by factor, using the company’s own SEC filings, its fiscal 2027 first-quarter earnings call, and the latest results from rivals Adidas, On, and Hoka. We update our earlier Nike case study with everything that has changed since June. Calculations we made ourselves are labeled as such.
Key Takeaways
- Strength: Nike’s performance portfolio (running, football, basketball, training, tennis, golf) grew high single digits in Q1 FY2027 on top of a $16 billion year, and North America wholesale grew 9%.
- Weakness: Sportswear (just under half of revenue) fell low double digits, Jordan fell mid-teens, and Greater China fell 26% on a currency-neutral basis.
- Opportunity: Women’s sport, training, and a “made for China” product strategy offer growth; the Pace program targets about $2.5 billion in cumulative savings through fiscal 2031.
- Threat: Adidas grew 14% currency-neutral in Q2 2026, On grew 21.6%, and Nike’s own guidance assumes China gets worse before it gets better.
- Watch: Nike’s Investor Day in November will lay out its long-term growth targets.
What Is a SWOT Analysis?
A SWOT analysis is a framework that sorts a company’s situation into four boxes: Strengths and Weaknesses (internal factors) and Opportunities and Threats (external factors). It helps students, investors, and managers see what a company does well, where it struggles, and what outside forces could help or hurt it.
In plain English: strengths and weaknesses are about Nike itself; opportunities and threats are about the world around Nike.
Nike SWOT Analysis at a Glance
| Helpful | Harmful | |
|---|---|---|
| Internal | Strengths: performance momentum; athlete and partnership ecosystem; restored wholesale ties in North America; innovation pipeline; net cash balance sheet | Weaknesses: Sportswear and Jordan slump; Greater China collapse; weak Nike Direct and Converse; thin margins and restructuring fatigue; dividend coverage |
| External | Opportunities: training and hybrid fitness; women’s sport; Sportswear reset by consumer segment; “made for China” strategy; Pace savings; football and events | Threats: On, Hoka, and Adidas; weak lifestyle demand; tariffs and trade policy; execution risk; talent turnover; investor sentiment |
Nike Snapshot: Where the Company Stands in October 2026
| Metric | Figure | Source |
|---|---|---|
| Q1 FY2027 revenue (quarter ended August 31, 2026) | $11.2 billion (down 4% reported, down 5% currency-neutral) | Nike Q1 FY2027 release (SEC) |
| Gross margin | 42.8% (up 60 basis points) | Nike Q1 FY2027 release (SEC) |
| Net income; diluted EPS | $712 million (down 2%); $0.48 | Nike Q1 FY2027 release (SEC) |
| FY2027 outlook | Revenue down high single digits; adjusted EPS $1.15 to $1.35 (excludes about $0.15 of Pace charges); EBIT expected to fall faster than revenue | Nike Q1 FY2027 release (SEC), call transcript |
| FY2026 revenue (year ended May 31, 2026) | $46.4 billion; net income $3.1 billion | Nike FY2026 10-K (SEC) |
| Pace program | About $2.5 billion cumulative savings through FY2031; about $1.0 billion pre-tax charges | Nike Q1 FY2027 release (SEC) |
| Leadership | Elliott Hill, CEO; Dave Denton, CFO (since August 17, 2026) | Nike CFO announcement (SEC) |
| Cash and short-term investments | $8.4 billion | Nike Q1 FY2027 release (SEC) |
Nike SWOT Analysis: Strengths
S1. A Global Brand With Unmatched Scale
Nike describes itself as the world’s leading designer, marketer, and distributor of athletic footwear, apparel, equipment, and accessories. It generated $46.4 billion of revenue in fiscal 2026 and $11.2 billion in the latest quarter alone. North America is the anchor: it was $5.13 billion of Q1 revenue, about 47% of NIKE Brand revenue (our calculation from the Q1 release).
Scale matters because it funds product development, athlete deals, and marketing at a level few competitors can match. For the full-year picture, see our Nike case study.
S2. Performance Portfolio Momentum
This is Nike’s clearest strength right now. CEO Elliott Hill said the performance business grew to $16 billion in fiscal 2026 (up mid-single digits) and grew another high single digits in Q1 FY2027. CFO Dave Denton added that excluding the Greater China reset, performance would have been up low double digits.
By sport, Q1 showed double-digit growth in Running, Global Football, Tennis, and Golf, and North America basketball grew double digits. In running, Nike says it nearly tripled its share of the max-cushioning category over the past year, led by the Vomero franchise, per the earnings call transcript.
The catch: management itself said performance isn’t yet big enough to offset the pressure from Sportswear, Jordan, and Greater China.
S3. A Sport and Athlete Ecosystem Rivals Struggle to Copy
Nike’s “Sport Offense” strategy ties product, marketing, and retail to specific sports and local moments. The Q1 call gave concrete examples:
- Around 1,000 university partnerships reaching more than 13 million students in North America, plus the Blue Ribbon Elite program for NIL athletes. Around the Texas vs. Ohio State game, Nike announced 13 new NIL athletes across eight sports.
- Partnerships with clubs and federations including FC Barcelona, Paris Saint-Germain, and an upcoming German Football Association deal.
- A women’s basketball signature business that grew nearly 500% from fiscal 2022 to fiscal 2026, and the Caitlin 1 launch in 5,000 doors, the largest women’s signature shoe launch in Nike’s history and about twice the average for a Nike basketball signature release.
S4. Restored Wholesale Relationships and North America Strength
After years of pulling back from retail partners, Nike is winning shelf space again. In Q1, North America wholesale revenue rose 9% (currency-neutral), North America revenue grew 2%, and North America EBIT rose 3% to $1.17 billion, per the Q1 release.
Hill said performance product is selling through at sporting goods partners including Dick’s, Academy, SCHEELS, Athletic Specialties, JD, and Foot Locker.
S5. A Deep Innovation Pipeline
Nike launched four new running footwear innovations in two months: Pegasus Plus 2 (August), Alphafly 4 (September), and the Swooshfly and Nike Apex (October 1). Nike says the Apex delivers 40% more energy than the Alphafly 3, which is a company claim. In training, Nike Mind has become one of its top-selling franchises, and the new Nike Hybrid Footwear System targets the fast-growing hybrid racing and strength-training market.
S6. A Net Cash Balance Sheet
Nike ended the quarter with $8.37 billion in cash and short-term investments against about $7.89 billion of debt, which works out to a modest net cash position of roughly $0.5 billion before leases (our calculation from the balance sheet). Denton said Nike is in a net cash position, with leverage of roughly 2 times including leases. In Q1, Nike returned about $610 million to shareholders through dividends.
Gross margin also improved 60 basis points to 42.8%, helped by lower warehousing and logistics costs, and selling and administrative expense fell 3%.
S7. Marketing Muscle and Event Leverage
Nike spent $4.754 billion on demand creation (its marketing line) in fiscal 2026 and $1.25 billion in Q1 FY2027, up 5%, driven by investment in key sports events. The payoff is visible: World Cup team kit sales doubled versus the 2022 tournament, and club football kits grew high teens afterward.
Nike SWOT Analysis: Weaknesses
W1. The Sportswear (Lifestyle) Slump
NIKE Sportswear made up just under half of Q1 revenue and fell low double digits. Nike cut Dunk revenue by nearly 50% on purpose, which created a roughly $200 million headwind (about 1.8% of total quarterly revenue, our calculation). Beyond that, some older, higher-volume Sportswear footwear sold through below expectations, and Hill acknowledged a lack of energy in the lifestyle category that is hurting traffic.
The effects reach wholesale partners: Nike is working with them to clear excess inventory, which has already affected future order books.
W2. Jordan Brand Oversupply
Jordan Brand was 13% of Nike’s Q1 revenue and fell by mid-teens. Hill said Nike has been oversupplying its iconic retro product and will deliberately cut the volume and frequency of specific Jordan Retro launches to restore scarcity, with North America feeling the biggest impact. CFO Denton said Sportswear and Jordan together represented a high-single-digit drag on consolidated revenue.
W3. Greater China
Greater China revenue was $1.18 billion in Q1, down 26% currency-neutral (down 22% reported). Wholesale fell 31% and NIKE Direct fell 18% (currency-neutral). EBIT dropped 34% to $248 million.
Two of our calculations show how much this hurts:
- Greater China fell from about 13.3% of NIKE Brand revenue a year ago to about 10.8%.
- Its EBIT decline of $129 million was larger than the entire $126 million decline in the four geographies’ combined EBIT.
Nike is cleaning up its digital distribution there, eliminating channels that fueled deep discounting. Denton said the full-year guidance assumes China revenue gets worse for the rest of the year.
W4. A Weak Direct Channel
NIKE Direct revenue was $4.14 billion in Q1, down 9% currency-neutral, with NIKE Brand Digital down 13% and Nike-owned stores down 5%. The declines were widespread: North America Direct fell 6%, EMEA Direct 12%, and Greater China Direct 18%. For the full fiscal 2026 year, NIKE Direct was $17.7 billion, down 6%.
This is the legacy of the aggressive direct-to-consumer push we examined in the Nike case study.
W5. Converse in Decline
Converse revenue was $263 million in Q1, down 28% with declines in all territories, and its EBIT fell 36% to $25 million. For fiscal 2026, Converse revenue was $1.2 billion, down 31%. Nike’s annual report expects negative impacts from Greater China and Converse to continue throughout fiscal 2027.
W6. Thin Margins and Restructuring Fatigue
Q1 EBIT margin was 8.1%. Nike expects fiscal 2027 EBIT to decline by a larger percentage than revenue, citing gross margin pressure, fixed-cost deleverage, and higher input costs. Adjusted EPS guidance of $1.15 to $1.35 compares with $2.10 of diluted EPS in fiscal 2026. That fiscal 2026 figure included a one-time tariff-refund benefit worth about $0.52 per share, so excluding it the base was roughly $1.58 (our calculation).
Pace is also costly: about $1.0 billion of charges through fiscal 2031, on top of about $0.3 billion of severance costs in fiscal 2026. BNP Paribas analysts called it Nike’s third restructuring program since fiscal 2024, said the first two cost a combined $828 million, and wrote that they had seen no operating leverage, per People Matters.
W7. Dividend Coverage and Leadership Transition
Nike declared a dividend of $0.41 per share in Q1. Annualized, that’s $1.64 per share against adjusted EPS guidance with a midpoint of $1.25, which implies a payout ratio of about 131% (our calculation; it uses the current quarterly rate and ignores Pace charges). An analyst raised this on the call, and Denton replied that the dividend is a significant priority and that Nike has support for maintaining and ultimately growing it under all scenarios.
Leadership is also in flux. Dave Denton joined as CFO on August 17, 2026, replacing Matthew Friend, and Greater China has had a new leadership team for about six months.
Nike SWOT Analysis: Opportunities
O1. Training and Hybrid Fitness
Hill called training one of Nike’s largest untapped performance opportunities, because every athlete trains. Nike Mind, Nike Pro, Metcon, the new Hybrid Footwear System (launched at the HYROX World Championships), and the Hyperslide recovery product from its Hyperice partnership give it a portfolio in a fast-growing category.
O2. Women’s Sport
Women’s basketball signature sales grew nearly 500% in four years, and Nike is leaning in with Caitlin 1, plus signature lines tied to A’ja Wilson and Sabrina Ionescu. Nike’s largest holiday product campaign supports the Caitlin launch. Women’s sport is both a growth category and a brand-differentiation story.
O3. Resetting Sportswear by Consumer Segment
Instead of selling one giant Sportswear business to one “lifestyle” consumer, Nike plans to organize it around specific consumer groups, the way it organizes performance. Early proof points from Q1: Studio Fleece (women’s) was the best-performing apparel collection of the quarter across all of Nike, Inc.; Air Force 1 is driving a stable full-price business; and running-inspired styles like the P-6000 and V5 Runner grew by strong double digits.
O4. A “Made for China” Strategy
Nike’s plan for Greater China has four parts: fewer, higher-quality official digital storefronts on Tmall, JD, and Douyin plus Nike.com and the app; refreshing partners’ physical doors (most haven’t been refreshed in seven years); sport-led experiences; and local product creation. Nike’s first collection designed for China launches in October, in brick-and-mortar only.
There are early signs it can work. The Shanghai House of Innovation delivered 10 consecutive months of growth after shifting to a sport-led experience, and China running has grown for six straight quarters, per the call transcript.
O5. Pace: Savings and a Leaner Operating Model
Pace targets about $2.5 billion in cumulative savings through fiscal 2031, with most realized in fiscal 2029 and 2030. It includes a more flexible supply chain, a new campus in Bengaluru, India, and a move from four geographies to three (the Americas, Asia Pacific & Greater China, and EMEA) starting in fiscal 2028, per the Nike filing and call. Denton said some savings are already showing up in gross margin.
O6. Football and the Global Sports Calendar
Nike is using the World Cup to refresh the global football marketplace, with team kit sales doubled versus 2022 and club kits up high teens. It’s also extending the playbook to college football (Texas, Ohio State, and soon Miami), marathons, and March Madness.
O7. Restoring Jordan’s Scarcity and Expanding Into Sport
By cutting retro supply, Nike aims to make the Jumpman feel earned again. Hill also pointed to Jordan growth in cleats, golf, and training, which would diversify the brand beyond retro basketball sneakers.
Nike SWOT Analysis: Threats
T1. Fast-Growing Challenger Brands
On Holding’s Q2 2026 net sales rose 21.6% currency-neutral to CHF 850.3 million, with apparel up 56.2% and a 65.4% gross margin, per On’s results. Hoka’s sales rose about 8% to $703.5 million in the June quarter. These brands compete for the same premium running and lifestyle shopper. (On lowered its outlook after weaker US wholesale sell-through, so the picture isn’t one-directional.)
T2. Adidas’s Comeback
Adidas posted record net sales of €6.74 billion in Q2 2026, up 14% currency-neutral, with Greater China up 15%, North America up 17%, and running up 28%, per Adidas. Adidas’s direct-to-consumer business grew 25% in Q2. While Nike’s China revenue fell 26%, Adidas’s grew 15%. Adidas also stepped up marketing around the World Cup, and its Q2 operating margin slipped to 8.5%, so the growth wasn’t free.
T3. Weak Lifestyle Demand and a Cautious Consumer
Nike’s own commentary describes a cautious consumer and low energy in lifestyle. Adidas reported that footwear grew just 1% in Q2, weighed down by weak lifestyle demand and heavy discounting, per Investing.com’s summary. Reducing supply to restore full-price selling means Nike expects pressure on reported revenue for the rest of fiscal 2027 and into 2028.
T4. Tariffs and Trade Policy
The Supreme Court ruled on February 20, 2026 that the IEEPA tariffs were unauthorized, and Nike reported that it had paid about $1.0 billion of them by the time of its fiscal third-quarter filing. In Q4 FY2026 Nike booked a $986 million benefit in cost of sales for recovering those tariffs, and it had collected substantially all of the receivable after May 31, according to its 10-K. That one-time gain flattered fiscal 2026 results.
The bigger point is policy volatility. Tariff rates on footwear have changed repeatedly, and Nike’s earlier estimate of $1.5 billion in annualized gross tariff costs, reported in 2025 by Digiday, shows how much exposure sourcing countries like Vietnam, Indonesia, and China create.
T5. Execution Risk
Pace involves layoffs beginning in calendar 2027, a reorganization into three geographies in fiscal 2028, a new CFO, and a China reset that management expects to take multiple seasons. Denton said the strategic actions in Sportswear, Jordan, and China will dampen performance through the rest of fiscal 2027 and likely bleed into 2028. Restructuring can distract teams exactly when product launches matter most.
T6. Athlete and Partner Turnover
Nike’s model depends on elite athletes and clubs. On the Q1 call, Hill said Nike’s relationship with footballer Kylian Mbappé, which lasted more than two decades, is ending as he makes a move, and pointed to Nike’s broader roster of football athletes and federations. One departure isn’t a crisis, but it shows that the roster Nike builds around can shift.
T7. Investor Sentiment
Business of Fashion reported that Nike’s shares have fallen more than 40% in 2026, and a Motley Fool article on October 16 said just 26% of Wall Street analysts rate Nike a buy (Business of Fashion, Motley Fool). Low sentiment can make it harder to fund a multi-year turnaround if results disappoint again.
How Nike Compares With Adidas, On, and Hoka
The table below compares each company’s most recent quarter. The periods and currencies differ, so treat it as a snapshot of momentum, not a precise ranking.
| Metric | Nike (Q1 FY27, Jun to Aug 2026) | Adidas (Q2 2026) | On (Q2 2026) | Hoka (Deckers, Jun quarter 2026) |
|---|---|---|---|---|
| Net sales | $11.2 billion | €6.74 billion | CHF 850.3 million | $703.5 million |
| Growth (currency-neutral unless noted) | −5% | +14% | +21.6% | +7.7% (reported) |
| Gross margin | 42.8% | 52.5% | 65.4% | Not broken out for Hoka |
| Greater China | −26% | +15% | n/a | n/a |
| North America | +2% | +17% | n/a | n/a |
| Notable | Performance up high single digits; Sportswear and Jordan down | Running +28%; DTC +25% | Apparel +56.2% | Slower growth than prior year |
Sources: Nike Q1 FY2027 release, Adidas, On, SGB Online.
Two takeaways. First, Nike is still far larger in absolute terms, with a single quarter’s revenue well above any of the three rivals. Second, its growth and gross margin trail the challengers, which is the gap Pace and the Sport Offense are meant to close.
Nike SWOT Analysis Summary Table (All 28 Factors)
The “Impact” column is our judgment of how much each factor matters to Nike’s outlook over the next two years.
| # | Factor | Key Evidence | Impact |
|---|---|---|---|
| S1 | Global brand and scale | $46.4B FY2026 revenue | High |
| S2 | Performance momentum | $16B business; up high single digits in Q1 | High |
| S3 | Athlete and sport ecosystem | 1,000 university partnerships; women’s signatures up about 500% | High |
| S4 | Wholesale and North America | NA wholesale +9%; NA EBIT +3% | High |
| S5 | Innovation pipeline | Four new running launches in two months | Medium |
| S6 | Net cash balance sheet | $8.4B cash and short-term investments | Medium |
| S7 | Marketing and event leverage | $1.25B Q1 demand creation; World Cup kits doubled | Medium |
| W1 | Sportswear slump | About half of revenue, down low double digits | High |
| W2 | Jordan oversupply | 13% of revenue, down mid-teens | High |
| W3 | Greater China | Revenue −26%; EBIT −34% | High |
| W4 | Weak Nike Direct | −9%; Digital −13% | High |
| W5 | Converse decline | −28%; FY2026 −31% | Low |
| W6 | Thin margins, restructuring fatigue | 8.1% EBIT margin; third restructuring since FY2024 | High |
| W7 | Dividend coverage, leadership change | About 131% payout on adjusted EPS guide (our calc); new CFO | Medium |
| O1 | Training and hybrid fitness | Nike Mind, Hybrid system | Medium |
| O2 | Women’s sport | Caitlin 1 in 5,000 doors | Medium |
| O3 | Sportswear segmentation | Studio Fleece best-performing apparel collection | High |
| O4 | “Made for China” strategy | Shanghai HOI up 10 straight months | High |
| O5 | Pace savings | About $2.5B through FY2031 | High |
| O6 | Football and events | Club kits +high teens | Medium |
| O7 | Jordan scarcity and diversification | Cleats, golf, training growth | Medium |
| T1 | Challenger brands | On +21.6%; Hoka $703.5M | High |
| T2 | Adidas comeback | +14% c/n; China +15% | High |
| T3 | Weak lifestyle demand | Adidas footwear +1% on discounting | High |
| T4 | Tariffs and trade policy | $986M refund; policy volatility | Medium |
| T5 | Execution risk | Layoffs from 2027; reorg in FY2028 | High |
| T6 | Athlete and partner turnover | Mbappé relationship ending | Low |
| T7 | Investor sentiment | Shares down 40%+ in 2026 | Medium |
Turning the Nike SWOT Analysis Into Action (TOWS)
A TOWS matrix pairs the four boxes to suggest strategies. This table is our analysis, not Nike’s plan.
| Opportunities | Threats | |
|---|---|---|
| Strengths | SO (use strengths to seize opportunities): Pair athlete partnerships and innovation with women’s sport, training, and football to grow where Nike already has momentum | ST (use strengths to blunt threats): Defend running share against On, Hoka, and Adidas with the new product cadence and strong wholesale sell-through |
| Weaknesses | WO (fix weaknesses by grasping opportunities): Use Pace savings to fund Sportswear segmentation and the China reset instead of broad cost cuts | WT (minimize weaknesses and avoid threats): Reduce dependence on Jordan retro, Converse, and China while protecting cash and the dividend through the downturn |
What to Watch Next
- Investor Day (November 2026): Management says it will share a long-term financial algorithm, details on Pace, and plans for Sportswear, Jordan, and Greater China.
- Q2 FY2027 results: Management flagged tougher comparisons, estimating about a 400 basis point revenue headwind from lapping last year’s Cyber Week promotions in EMEA and heavier North America sell-in.
- China: The first “made for China” collection arrives in October, and the digital cleanup is expected to take multiple seasons.
- Holiday sell-through: Watch Caitlin 1, Jordan retro scarcity, and Sportswear inventory at wholesale partners.
- Pace layoffs: Hill said they would take place in calendar 2027 and beyond.
- Rivals: Adidas and On will report again before Nike’s next results.
How to Use This Nike SWOT Analysis
For students: Pick three factors from each box, cite a number for each, and explain how they interact. For example, Nike’s performance momentum (S2) is real, but the Sportswear and Jordan slump (W1, W2) is bigger for now. A good answer shows the tension.
For investors: Treat the SWOT as a checklist, not a verdict. Watch whether performance growth starts to outweigh the drag from Sportswear, Jordan, and China, and whether Pace savings reach the P&L.
For marketers and founders: The Nike story shows how a dominant brand can lose momentum when it over-relies on one channel (direct), one franchise (retro), or one market (China). Finmaticx’s AI tools hub, Finmaticx GPT, and free AI prompt generator can help you outline and draft your own SWOT write-up.
Limits of SWOT: The framework is a snapshot. It doesn’t weigh factors against each other or predict outcomes, and the same fact can be argued as a strength or a weakness (for example, Nike’s scale). That’s why we added impact ratings and the TOWS table.
Case Study Discussion Questions
- Performance grew high single digits while Sportswear and Jordan fell. Is Nike’s core strength becoming smaller than its weaknesses, or is this a temporary reset?
- Nike is deliberately cutting supply of its most popular franchises (Dunk, Jordan retro). When does protecting brand scarcity justify giving up near-term revenue?
- Greater China’s EBIT drop was larger than the total decline across all four geographies. How should a global brand weigh a high-margin region that is declining quickly?
- This is Nike’s third restructuring since fiscal 2024. What would convince you that Pace is different from the earlier programs?
- Adidas’s China sales grew 15% while Nike’s fell 26%. What could explain the gap, and what data would you need to test your theory?
- At guidance, Nike’s dividend exceeds adjusted earnings per share by our estimate. Should a company in turnaround protect its dividend or its investment budget?
Need help structuring your answers? Try Finmaticx GPT.
Nike SWOT Analysis FAQ
What is Nike’s SWOT analysis? Nike’s SWOT analysis sorts its internal strengths and weaknesses and external opportunities and threats. In 2026, strengths include a growing performance business and restored wholesale ties; weaknesses include the Sportswear, Jordan, and Greater China declines; opportunities include women’s sport and training; threats include On, Hoka, Adidas, tariffs, and execution risk.
What are Nike’s biggest strengths? Its global brand and scale ($46.4 billion revenue in fiscal 2026), a performance portfolio that grew high single digits in Q1 FY2027, an athlete and partnership ecosystem, strong North America wholesale, a deep innovation pipeline, and a net cash balance sheet.
What are Nike’s biggest weaknesses? Sportswear (just under half of revenue) fell low double digits, Jordan fell mid-teens, Greater China fell 26%, NIKE Direct fell 9%, and Converse fell 28%. Margins are thin, and Nike is restructuring for the third time since fiscal 2024.
What opportunities does Nike have? Training and hybrid fitness, women’s sport, a Sportswear reset by consumer segment, a “made for China” product strategy, football and global events, and about $2.5 billion in savings from Pace through fiscal 2031.
What are the main threats to Nike? Fast-growing rivals (On grew 21.6% and Adidas 14% currency-neutral in their latest quarters), weak lifestyle demand, tariff and trade policy volatility, execution risk from restructuring, and athlete turnover.
Why did Nike’s revenue fall in Q1 fiscal 2027? Revenue was $11.2 billion, down 4% (5% currency-neutral), mainly because of declines in Greater China and EMEA, partly offset by North America growth. Nike also deliberately cut Dunk revenue by nearly 50% and reduced supply in parts of Sportswear and Jordan.
What is Nike Pace? Pace is a multi-year operating model transformation announced October 1, 2026. It includes supply chain modernization, a new campus in Bengaluru, India, a move to three geographies, and workforce reductions, targeting about $2.5 billion of cumulative savings through fiscal 2031 for about $1.0 billion in charges.
What is Nike’s fiscal 2027 guidance? Nike expects revenue to decline by a high-single-digit percentage, EBIT to fall by more than revenue, and adjusted diluted EPS of $1.15 to $1.35, excluding about $0.15 of Pace restructuring expense.
How is Nike doing in China? Poorly in the near term. Greater China revenue fell 26% currency-neutral in Q1 and EBIT fell 34%, and management expects China to get worse for the rest of the fiscal year as it cleans up digital distribution. It points to growth in running and the Shanghai House of Innovation as early positives.
Is Nike’s dividend safe? Management says the dividend is a significant priority and that it has support to maintain and grow it under all scenarios. By our calculation, the current annualized dividend of $1.64 exceeds the midpoint of adjusted EPS guidance ($1.25). This isn’t a forecast or advice.
Who are Nike’s biggest competitors? Adidas, On, Hoka (Deckers), Puma, Asics, and Brooks in footwear and apparel, plus lifestyle and athleisure brands. In recent quarters, Adidas, On, and Hoka have grown faster than Nike.
Who is Nike’s CEO and CFO? Elliott Hill is President and CEO. Dave Denton became Executive Vice President and CFO on August 17, 2026, succeeding Matthew Friend.
How much does Nike spend on marketing? Nike’s demand creation expense was $4.754 billion in fiscal 2026 and $1.25 billion in Q1 FY2027, up 5% on higher investment in key sports events.
When does Nike report next? Nike will hold an Investor Day in November 2026 and report fiscal Q2 results after that. Check Nike’s investor site for exact dates.
More Business Case Studies on Finmaticx
If this guide was useful, these related breakdowns on Finmaticx use the same data-first approach. You can also browse the full business case studies category.
- Nike Case Study: Business Model, Strategy and Revenue Breakdown: the full-year fiscal 2026 view of Nike’s channels and turnaround.
- Weightworld Case Study: UK to Pan-European D2C Empire: how a direct-to-consumer brand scaled across markets.
- ChatGPT Ads Case Study: How OpenAI Built a Billion-Dollar Ad Business in Months: attention as a business model.
- How Does Shopify Make Money? 101 Revenue Breakdown: the platform behind direct-to-consumer commerce.
- How Does Klarna Make Money? Full Business Model Explained (2026): buy now, pay later economics.
- How Does Zelle Make Money? The Full Business Model Explained (2026): free payments and who pays for them.
- How Does NerdWallet Make Money? 5 Revenue Streams Explained (2026): referral-fee economics.
- How Does Webull Make Money? Webull Business Model: what “zero commission” really means.
- How Does PhonePe Make Money?, How Does Meesho Make Money?, and How Does Zerodha Make Money?: three India-focused business models.
Want to know who writes this and why? Read What Is Finmaticx? Mission, Purpose and How It Helps Businesses, learn more about us, or explore Finmaticx AI’s free tools and our Ads GPT. Have a company you’d like us to analyze next? Contact us.
Sources and Methodology
Nike is a public company, so most figures here come directly from its SEC filings, earnings release, and earnings call. Where we calculated a figure ourselves (shares of revenue, net cash, payout ratio, EBIT changes, the Dunk headwind as a share of revenue), the text says so. Quotes and characterizations of management come from the published call transcript. Competitor figures come from each company’s own releases, and the periods differ from Nike’s, so the comparison table shows momentum, not an exact ranking. The impact ratings in the summary table and the TOWS matrix are our judgments. Data was last checked on October 16, 2026. Nike’s Investor Day and fiscal Q2 results had not yet occurred.
Nike filings and company sources
- Nike Q1 FY2027 earnings release (SEC) and Pace 8-K (SEC)
- Nike Q1 FY2027 Form 10-Q (SEC)
- Nike FY2026 Form 10-K (SEC) and FY2026 Annual Report to Shareholders (SEC)
- Nike Q4 FY2026 earnings release (SEC)
- Nike CFO transition announcement (SEC)
- Nike Investor Relations and Nike on SEC EDGAR
- Nike Q1 FY2027 earnings call transcript (Motley Fool)
Press and analysis
- Pace and Q1 coverage: Sportico, Business of Fashion, SGB Online, People Matters, and Tech Times
- Tariffs: Supply Chain Dive and Digiday
- Competitors: Adidas Q2 2026 release, Investing.com: Adidas Q2 2026, On Q2 2026 results, SGB Online: running footwear, and Yahoo Finance: On and Deckers
- Sentiment: Motley Fool, October 16, 2026