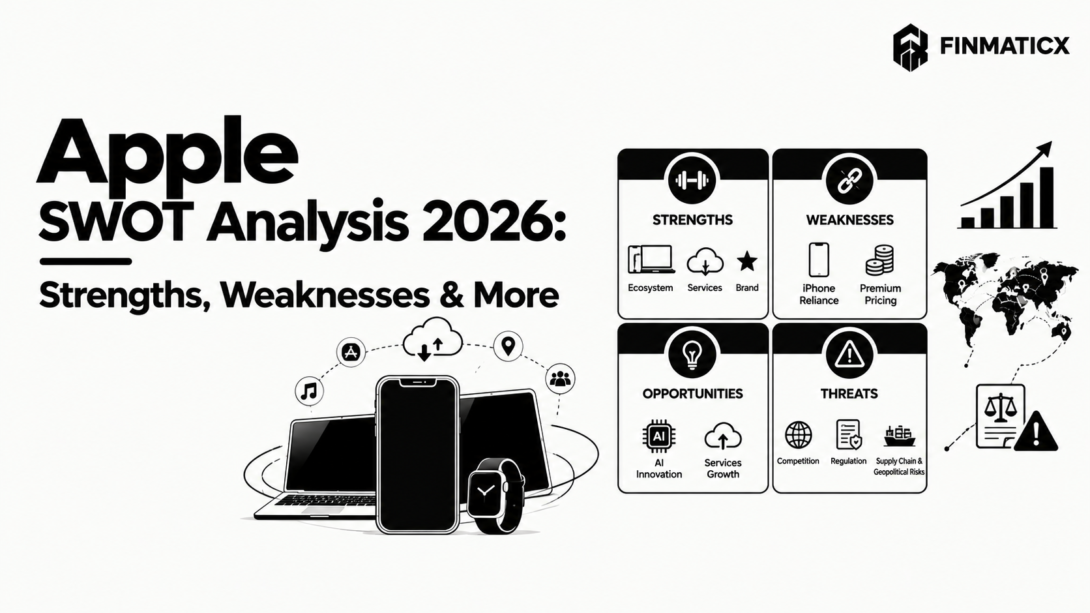
An Apple SWOT analysis in 2026 has an unusual problem: almost everything on the page changed in the last six months. Apple reported a record June quarter, with revenue up 16% to $109.4 billion. It handed the CEO job from Tim Cook to John Ternus on September 1. It rebuilt Siri on a custom version of Google’s Gemini. And pre-orders for its first foldable iPhone, priced from $1,999, open October 16.
At the same time, Apple told investors that supply constraints would “increase significantly” this quarter and that memory chip prices were rising so fast that its gross margin would fall by roughly two to three points. Its own guidance for the September quarter, a 9% to 11% revenue gain, came in about five points below June’s growth.
So is Apple at a peak, or at a turning point? This guide breaks down the Apple SWOT analysis factor by factor, using the company’s SEC filings, its fiscal Q3 2026 earnings call, the new-product announcements from September 9, and current smartphone market data from IDC and Counterpoint. Calculations we made ourselves are labeled as such.
Key Takeaways
- Strength: Services is a $109 billion business (fiscal 2025) with a 75.6% gross margin in the latest quarter, and by our calculation it produces about 42% of Apple’s gross profit from 28% of its revenue.
- Weakness: The iPhone still brings in about half of revenue, and supply and memory costs are squeezing the September quarter.
- Opportunity: The iPhone Duo foldable, a rebuilt Siri, and Mac momentum give Apple three new growth levers at once.
- Threat: A global memory shortage is shrinking the smartphone market (IDC forecasts a 16.7% drop in 2026 shipments), while antitrust cases threaten App Store economics.
- Watch: Apple reports fiscal Q4 results on November 2, in John Ternus’s first earnings call as CEO.
What Is a SWOT Analysis?
A SWOT analysis is a framework that sorts a company’s situation into four boxes: Strengths and Weaknesses (internal factors) and Opportunities and Threats (external factors). It helps students, investors, and managers see what a company does well, where it struggles, and what outside forces could help or hurt it.
In plain English: strengths and weaknesses are about Apple itself; opportunities and threats are about the world around Apple.
Apple SWOT Analysis at a Glance
| Helpful | Harmful | |
|---|---|---|
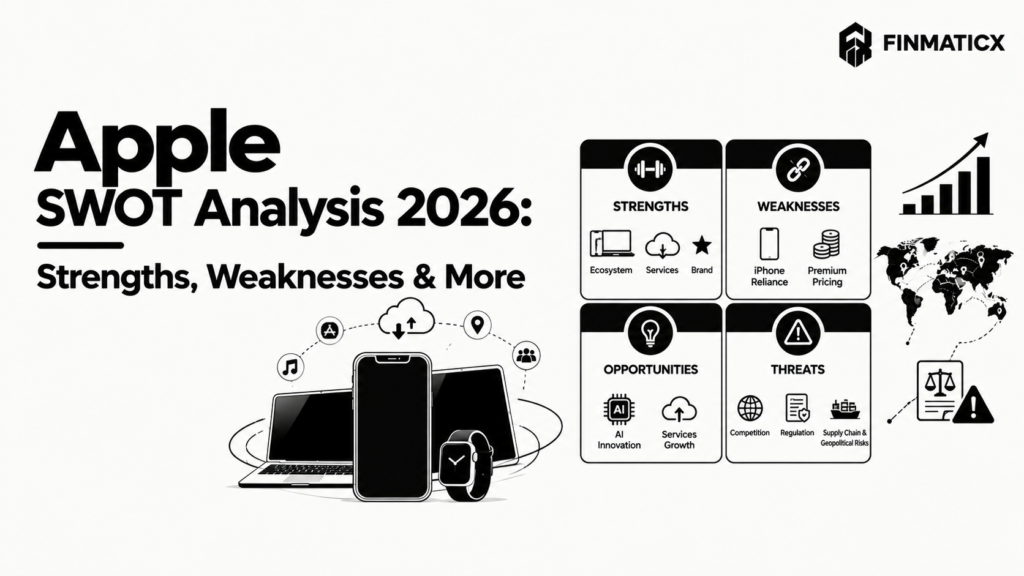
| Internal | Strengths: 2.5 billion active devices; Services profit engine; iPhone momentum; huge cash generation; custom silicon; privacy brand; pricing power | Weaknesses: iPhone concentration; supply and memory squeeze; AI perception gap and reliance on Google; Services miss; iPad and wearables stagnation; rising costs; leadership transition |
| External | Opportunities: iPhone Duo foldable; Siri AI and upgrade cycle; Mac and low-cost laptops; China and emerging markets; Services expansion; developer AI tools; premium consolidation | Threats: memory shortage; antitrust and App Store rulings; tariffs; Samsung and Huawei; AI disruption; China concentration; price sensitivity |
Apple Snapshot: Where the Company Stands in October 2026
| Metric | Figure | Source |
|---|---|---|
| Fiscal 2025 revenue (year ended September 27, 2025) | $416.2 billion (+6%); net income $112.0 billion | Apple FY2025 10-K (SEC) |
| Q3 FY2026 revenue (quarter ended June 27, 2026) | $109.4 billion (+16%); diluted EPS $2.02 (+29%) | Apple Q3 FY2026 release (SEC) |
| Q3 gross margin | 50.1%, including about 2 points from tariff refunds | Apple Q3 FY2026 call |
| September-quarter guidance | Revenue growth of 9% to 11%; gross margin 47% to 48% (includes about 1 point of tariff refund benefit) | Investing.com call summary |
| Cash and marketable securities; total debt | $147 billion; $84 billion | MacRumors |
| Installed base | More than 2.5 billion active devices | Yahoo Finance call highlights |
| Leadership | John Ternus, CEO (since September 1, 2026); Tim Cook, executive chair; Kevan Parekh, CFO | Apple 8-K (SEC) |
| Next earnings date | Q4 FY2026 results on November 2, 2026 | MacRumors |
Apple SWOT Analysis: Strengths
S1. An Ecosystem of More Than 2.5 Billion Active Devices
Apple’s biggest asset isn’t any single product. It’s the installed base. In the June quarter, CFO Kevan Parekh said the installed base of active devices reached a new all-time high across all major product categories and all geographic segments, and coverage of the call put it at more than 2.5 billion devices. Apple also reported about 1.5 billion subscriptions across its services, according to Yahoo Finance’s call highlights.
That base is the reason new products land with a built-in audience, and the reason Services keeps growing.
S2. The Services Profit Engine
Services net sales were $109.2 billion in fiscal 2025, up 14%, driven by advertising, the App Store, and cloud services, per the 10-K. In Q3 FY2026, Services revenue was a June-quarter record $30.74 billion (up 12%), with all-time records in cloud services and payment services, and a gross margin of 75.6%.
Here is the calculation that matters. With products gross margin at 40.1%, Services produced roughly $23.2 billion of the quarter’s $54.8 billion of gross profit, about 42%, from only 28% of revenue (our calculation from the reported margins). For deeper context on how payment and platform businesses earn money, see our breakdowns of how Zelle makes money and how PhonePe makes money.
S3. iPhone Momentum
iPhone revenue was $54.25 billion in Q3 FY2026, up 22%, driven by strong demand for the iPhone 17 family and market share gains. Counterpoint reports the iPhone 17 series remains the world’s top-shipped smartphone lineup. For all of fiscal 2025, iPhone revenue was $209.6 billion, up 4%, led by Pro models.
S4. Enormous Cash Generation and Financial Flexibility
Apple generated $34.4 billion of operating cash flow in the June quarter, a June-quarter record even excluding tariff refunds, and $117.0 billion in the first nine months of fiscal 2026 (10-Q). It ended the quarter with $147 billion of cash and marketable securities and $84 billion of debt, a net cash position of about $63 billion (our calculation).
In Q3 it returned $33 billion to shareholders: $25.8 billion in buybacks and $4.0 billion in dividends. In May, Apple authorized another $100 billion for repurchases, raised its dividend 4% to $0.27 a quarter, and stopped treating net cash neutral as a formal target, according to the Q2 call.
S5. Custom Silicon and Tight Hardware-Software Integration
Apple designs its own chips, devices, and operating systems. The payoff showed up in the Mac: Q3 Mac revenue was $10.35 billion, up 29%, Apple’s best June quarter ever, led by the MacBook Neo and MacBook Pro, with all-time records for customers new to Mac and for upgraders. The new CEO, John Ternus, previously ran hardware engineering, which signals how central this integration is.
S6. A Privacy-Centered Brand and Architecture
Apple’s AI pitch rests on on-device processing plus Private Cloud Compute, a system Apple says keeps personal data from being stored or accessed by Apple or others and which outside experts can verify. That privacy positioning is a differentiator against cloud-first assistants, and it fits Apple’s long-standing brand.
S7. Pricing Power and Share Gains in a Shrinking Market
The smartphone market contracted in Q2 2026, with IDC reporting shipments down 7.4% to 276.3 million units, but Apple shipped 55.7 million iPhones, up about 15% from 48.5 million a year earlier (our calculation from IDC’s table), taking its share to 20.2%. It also raised prices: the iPhone 18 Pro starts at $1,199, $100 more than the iPhone 17 Pro, per CNBC.
Apple SWOT Analysis: Weaknesses
W1. Heavy Dependence on the iPhone
The iPhone accounted for 50.4% of fiscal 2025 revenue ($209.6 billion of $416.2 billion) and about 49.6% of Q3 FY2026 revenue (our calculation). Services is large, but it depends on iPhone users. When iPhone supply or demand slips, the whole company feels it.
W2. Supply Constraints and a Memory-Cost Squeeze
This is the most urgent weakness. Apple said constraints on the advanced chip manufacturing nodes that its processors use held back the Mac in the June quarter, and that the impact “increases significantly” in the September quarter, hitting iPhone, Mac, and iPad, with little flexibility in the supply chain to fix it (call transcript).
Memory costs are the other half. Management described the memory market as a once-in-a-century flood, and Parekh said memory costs explained more than 100% of the sequential gross margin decline. The adjusted gross margin fell from 49.3% in the March quarter to 48.1% in June (excluding tariff refunds), and September guidance is 47% to 48%, which includes about a point of tariff refund benefit, implying an underlying 46% to 47% (our arithmetic).
The effect is already visible in guidance: 9% to 11% growth for the September quarter, versus 16% in June. MacRumors calculates that implies $111.7 billion to $113.7 billion in revenue, based on last year’s $102.5 billion.
W3. An AI Perception Gap and Reliance on Google
Apple spent two years promising a smarter Siri. The rebuilt version, Siri AI, was unveiled at WWDC26 on June 8, 2026, and began rolling out in English beta with iOS 27 on September 14. But the foundation models behind it are built on Google’s Gemini, under a multi-year partnership confirmed in a joint statement in January and widely reported at about $1 billion a year.
Apple controls the on-device experience and the privacy layer, but depending on a competitor’s models raises long-term questions about who owns the AI stack. CNBC’s live coverage of the September event also described the reception of Siri AI since June as lackluster.
W4. A Services Miss and a Contested Revenue Base
Services revenue of $30.74 billion was below the roughly $31.2 billion analysts expected, and growth of 12% was a step down from fiscal 2025’s 14%, though Apple pointed to foreign exchange headwinds (Yahoo Finance). More important, parts of Services rest on App Store fees that courts and regulators are challenging (see Threat T2).
W5. iPad and Wearables Stagnation
iPad revenue fell 6% to $6.19 billion in Q3 against a difficult comparison with last year’s launch, and Wearables, Home and Accessories grew only about 6% to $7.88 billion. Together they were about 13% of quarterly revenue (our calculation), and neither is a growth engine today.
W6. Rising Operating Costs
Operating expenses were $19.1 billion in Q3, up 23% year over year, driven by R&D investment, and guidance for September is $19.1 billion to $19.4 billion. Revenue grew 16%, so costs are growing faster. That’s a choice, mainly for AI, but it raises the bar for margins if supply and memory problems persist.
W7. A Leadership Transition at a High-Stakes Moment
John Ternus became CEO on September 1, 2026, ending Tim Cook’s 15 years in the role, and his first product presentation came September 9. Cook remains executive chair and will engage with policymakers, per Apple’s announcement. The succession was planned and orderly, but it comes with a new CEO’s first launch cycle, a Gemini-dependent AI rollout, and tight supply all at once. The stock’s muted reaction to the Duo launch suggests investors are watching closely.
Apple SWOT Analysis: Opportunities
O1. The iPhone Duo Foldable
On September 9, Apple unveiled its first foldable, the iPhone Duo, with a 7.6-inch inner display, priced from $1,999 (256 GB) to $3,199 (2 TB). Pre-orders opened October 16, with availability starting October 23 in more than 70 countries and a second wave of 28 countries on October 30, according to Futurum and Variety.
Futurum estimates Apple could capture roughly 31% of the growing foldable market, though that is an analyst projection. The Duo won’t affect the September quarter, which ended September 26, so its first financial impact lands in fiscal Q1 2027.
O2. Siri AI and an AI-Driven Upgrade Cycle
If Siri AI works as promised, with the ability to draw on personal context from messages, email, and photos and take actions across apps, it gives users a reason to upgrade within a base of more than 2.5 billion devices. Apple says Siri AI works with more than 300,000 apps, per CNBC’s event coverage. Apple also received approval in China to ship its original Apple Intelligence features, with more work ahead for Siri AI there, according to a summary of the Q3 call.
For more on how AI is changing products and marketing, explore Finmaticx’s AI tools hub and Finmaticx GPT.
O3. The Mac and Lower-Priced Laptops
Mac revenue grew 29% in the June quarter, with all-time records for new-to-Mac customers and an all-time revenue record in Greater China. The MacBook Neo has helped widen the funnel. Mac is a smaller business ($33.7 billion in fiscal 2025, about 8% of revenue), but each new Mac customer deepens the ecosystem.
O4. Greater China and Emerging Markets
After three straight years of decline, Greater China rebounded: revenue was $18.8 billion in Q3 (up 22%) and $64.8 billion in the first nine months of fiscal 2026, up about 30% and already above the $64.4 billion for all of fiscal 2025 (our comparison of reported figures). IDC’s Q2 data shows Apple’s China share rising to 18.1% from 13.9% as shipments grew 24.4% in a market that shrank 4.3%.
Apple also set an all-time revenue record in emerging markets in the June quarter. It hadn’t raised iPhone prices in China as of the quarter, which CNBC noted helped it take share.
O5. Services Expansion
Beyond the App Store, Apple reported all-time records in cloud services and payment services in Q3. Advertising, payments, and cloud storage can grow with the installed base. And if Siri AI becomes a daily habit, it opens new service possibilities.
O6. Developer and Platform AI Tools
Apple is giving developers access to its next-generation Foundation Models, including free cloud inference on Private Cloud Compute for small developers in the App Store Small Business Program (those with fewer than 2 million lifetime downloads), according to ITWire. That strengthens the platform moat if developers build AI features for iOS.
O7. Consolidation Toward Premium Brands
IDC said the memory crisis is splitting the smartphone market in two, with Samsung and Apple gaining share at the top while the mass market contracts sharply. When component costs rise, cheaper Android brands struggle, and Apple’s scale and supply contracts help. Smart Analytics Global found that smartphones priced at $600 and above were the key growth segment in Q2.
Apple SWOT Analysis: Threats
T1. The Global Memory Shortage
AI-driven demand for memory chips is raising component prices across the industry. IDC now forecasts worldwide smartphone shipments to fall 16.7% in 2026, to just over 1 billion units, a record drop, and Counterpoint expects about a 14% decline with shortages likely to continue into 2027 (IDC, Android Authority). Apple’s own 10-Q says it expects supply constraints and component cost increases to intensify and that they may materially adversely affect demand, revenue, and gross margin.
T2. Antitrust and App Store Rulings
Apple faces several fronts:
- US Department of Justice: A civil antitrust lawsuit in New Jersey alleges monopolization in smartphone markets.
- Epic Games: A court found Apple in contempt of an injunction over its App Store, and the Ninth Circuit held that a 27% commission on external purchases defeated the injunction’s purpose. The Supreme Court declined to pause the order in May (CNBC). Apple is pursuing a Supreme Court review, and some trade coverage reports the court has agreed to hear the case, though we couldn’t confirm that in Apple’s filings.
- European Union: Digital Markets Act investigations continue, and Apple says it complies.
All of these are described in Apple’s 10-Q. Because Services carries a 75.6% margin, even small fee changes could matter.
T3. Tariffs and Trade Policy
Apple’s Q3 results were helped by tariff refunds: gross margin included about two points from refunds and EPS included $0.11. By our estimate, two points of margin on $109.4 billion is roughly $2 billion. That’s a one-time benefit, not a run rate, and Apple’s 10-Q warns that tariffs on imports from China, India, Japan, South Korea, Taiwan, Vietnam, and the EU can materially affect pricing and gross margin.
T4. Samsung, Huawei, and Android Competition
Samsung leads global shipments with a 22.7% share (62.7 million units) in Q2, ahead of Apple’s 20.2%, per IDC. In China, Huawei holds 22.6% of the market against Apple’s 18.1%. Samsung also has a head start in foldables, though the iPhone Duo is aimed squarely at that market.
T5. AI Disruption and Narrative Risk
AI assistants are changing how people use devices. Apple’s decision to build Siri AI on Google’s models answers the capability gap, but it also puts a rival’s technology inside the iPhone experience, and analysts expect Apple to migrate more of the workload to its own models over time. If AI-native devices or assistants take off, Apple’s hardware advantage could matter less.
T6. China Concentration
Greater China was 15.5% of fiscal 2025 revenue ($64.4 billion of $416.2 billion, our calculation), and most Apple products are assembled in Asia. The recent rebound is encouraging, but Apple has to navigate government approvals (Siri AI isn’t yet approved for China) and US-China tensions at the same time.
T7. Price Sensitivity
Apple has raised prices on the iPhone 18 Pro (+$100), and on the call said it reluctantly raised iPad and Mac prices because of memory inflation, with price-elasticity effects still too early to assess, per a summary of the call. The $1,999 iPhone Duo is a test of how far premium pricing can stretch in a market where overall shipments are falling.
How Apple Compares With Samsung, Huawei, and Xiaomi
| Metric | Apple | Samsung | Xiaomi | Huawei |
|---|---|---|---|---|
| Global shipments, Q2 2026 | 55.7 million | 62.7 million | 31.2 million | n/a |
| Global share, Q2 2026 | 20.2% | 22.7% | 11.2% | n/a |
| Global shipment growth (YoY) | About +15% (our calculation) | +8.1% | −26.3% | n/a |
| China share, Q2 2026 | 18.1% | 0.1% | 12.4% | 22.6% |
| China shipment growth (YoY) | +24.4% | −60.8% | −21.7% | +19.4% |
Sources: IDC global tracker, IDC China blog, and Ubergizmo’s summary of IDC’s preliminary data. Counterpoint’s figures differ slightly (it has Samsung at 24% and Apple’s Q2 share at 21%, its highest for a second quarter). IDC and Counterpoint use different methods.
Two takeaways. First, in a down market, Apple and Samsung are both winning share while Chinese Android brands shrink. Second, Apple’s China comeback is real, but Huawei is still ahead there.
Apple SWOT Analysis Summary Table (All 28 Factors)
The “Impact” column is our judgment of how much each factor matters to Apple’s outlook over the next two years.
| # | Factor | Key Evidence | Impact |
|---|---|---|---|
| S1 | Ecosystem of 2.5B+ devices | Installed base at all-time high | High |
| S2 | Services profit engine | $109.2B FY2025; 75.6% margin; about 42% of gross profit (our calc) | High |
| S3 | iPhone momentum | Q3 iPhone $54.3B (+22%) | High |
| S4 | Cash generation | $34.4B Q3 operating cash flow; $147B cash | High |
| S5 | Custom silicon, integration | Mac +29% | Medium |
| S6 | Privacy brand and architecture | Private Cloud Compute | Medium |
| S7 | Pricing power, share gains | Shipments +15% in a shrinking market | High |
| W1 | iPhone concentration | About 50% of revenue | High |
| W2 | Supply and memory squeeze | Sept guide +9% to 11%; GM 47% to 48% | High |
| W3 | AI gap, Google reliance | Siri AI built on Gemini | High |
| W4 | Services miss, contested base | $30.7B vs. about $31.2B expected | Medium |
| W5 | iPad and wearables | iPad −6%; wearables +6% | Low |
| W6 | Rising operating costs | OpEx +23% | Medium |
| W7 | Leadership transition | Ternus CEO since September 1 | Medium |
| O1 | iPhone Duo foldable | $1,999 to $3,199; on sale October 23 | High |
| O2 | Siri AI upgrade cycle | iOS 27 beta; 300,000 apps | High |
| O3 | Mac and lower-priced laptops | Record new-to-Mac customers | Medium |
| O4 | China and emerging markets | China 9M $64.8B (+30%) | High |
| O5 | Services expansion | Cloud and payments records | Medium |
| O6 | Developer AI tools | Free Private Cloud Compute inference | Low |
| O7 | Premium consolidation | Mass market shrinking | Medium |
| T1 | Memory shortage | IDC: 2026 shipments −16.7% | High |
| T2 | Antitrust and App Store | DOJ, Epic, DMA | High |
| T3 | Tariffs and trade policy | Refund one-time; 10-Q warning | Medium |
| T4 | Samsung and Huawei | Samsung 22.7%; Huawei 22.6% in China | Medium |
| T5 | AI disruption | Rival models inside Siri | Medium |
| T6 | China concentration | 15.5% of FY2025 revenue (our calc) | Medium |
| T7 | Price sensitivity | iPhone 18 Pro +$100; Duo $1,999 | Medium |
Turning the Apple SWOT Analysis Into Action (TOWS)
A TOWS matrix pairs the four boxes to suggest strategies. This table is our analysis, not Apple’s plan.
| Opportunities | Threats | |
|---|---|---|
| Strengths | SO (use strengths to seize opportunities): Use the installed base and Services engine to monetize Siri AI and the Duo launch | ST (use strengths to blunt threats): Use cash generation and scale to secure chips and memory supply ahead of rivals in a shortage |
| Weaknesses | WO (fix weaknesses by grasping opportunities): Reduce iPhone dependence through Mac, Services, and a new foldable category | WT (minimize weaknesses and avoid threats): Reduce reliance on any single supplier, model partner, or fee structure before regulators or rivals force the issue |
What to Watch Next
- November 2, 2026: Fiscal Q4 results and guidance for the December quarter, on Ternus’s first call as CEO. The quarter covers only the first days of iPhone 18 Pro sales.
- October 23: iPhone Duo launch, and early read-through on foldable demand at $1,999 and up.
- Siri AI rollout: The English beta began September 14, and Apple has said more languages are coming. Watch for China and EU availability.
- Memory prices and chip supply: Whether Apple’s supply constraints ease or worsen.
- Epic v. Apple at the Supreme Court, and the DOJ case: a ruling on App Store fees would affect Services.
- Tariff policy and refunds: Apple is applying for refunds, and future quarters may not include the same benefit.
How to Use This Apple SWOT Analysis
For students: Choose three factors from each box, attach a number to each, and show how they interact. For example, Services profits (S2) depend on iPhone sales (W1), which depend on supply (W2). A good answer shows the connections.
For investors: Treat the SWOT as a checklist, not a verdict. Watch whether the Duo and Siri AI add growth faster than memory costs take away margin.
For marketers and founders: Apple shows how an ecosystem turns one product into a platform, and how fast it can be tested by supply, regulation, and AI shifts. Finmaticx’s free AI prompt generator and Finmaticx GPT can help you outline your own SWOT write-up.
Limits of SWOT: The framework is a snapshot. It doesn’t weigh factors against each other or predict outcomes, and the same fact can be a strength or a weakness (Apple’s iPhone dominance is both). That’s why we added impact ratings and the TOWS table.
Case Study Discussion Questions
- Services produces about 42% of gross profit from 28% of revenue, but it depends on iPhone users and App Store fees. Is Apple’s profit base more or less fragile than it looks?
- Apple built Siri AI on Google’s Gemini. Is that a smart bridge or a strategic dependence? What would make Apple end it?
- Memory prices are rising for the whole industry, but Apple has more scale than rivals. Is the memory shortage more of a threat or a competitive advantage for Apple?
- The iPhone Duo costs $1,999 to $3,199 in a shrinking smartphone market. What would success look like, and how would you measure it?
- A court has found Apple in contempt over App Store fees on external purchases. How should Apple plan for a world where it can charge less?
- Apple’s China revenue rebounded 30% over nine months after three years of decline. What risks come with relying on that rebound?
Need help structuring your answers? Try Finmaticx GPT.
Apple SWOT Analysis FAQ
What is Apple’s SWOT analysis? Apple’s SWOT analysis sorts its internal strengths and weaknesses and external opportunities and threats. In 2026, strengths include a 2.5-billion-device ecosystem and a high-margin Services business; weaknesses include iPhone concentration and supply constraints; opportunities include the iPhone Duo and Siri AI; threats include a memory shortage, antitrust cases, and competition.
What are Apple’s biggest strengths? Its installed base of more than 2.5 billion active devices, Services revenue of $109.2 billion in fiscal 2025 at a 75.6% gross margin in the latest quarter, iPhone momentum (Q3 iPhone revenue up 22%), strong cash generation, and custom silicon.
What are Apple’s biggest weaknesses? Dependence on the iPhone for about half of revenue, supply and memory-cost pressure, reliance on Google’s Gemini for Siri, a Services revenue miss in Q3, slower iPad and wearables, and a CEO transition.
What opportunities does Apple have? The iPhone Duo foldable, Siri AI and an AI-driven upgrade cycle, Mac momentum, growth in Greater China and emerging markets, and Services expansion into areas like cloud and payments.
What are the main threats to Apple? A global memory shortage, antitrust and App Store rulings, tariffs, competition from Samsung and Huawei, AI disruption, China concentration, and price sensitivity.
How much revenue does Apple make? Apple’s fiscal 2025 revenue was $416.2 billion and net income was $112.0 billion. In the first nine months of fiscal 2026, revenue was $364.4 billion, up 16%.
Who is Apple’s CEO? John Ternus became CEO on September 1, 2026, succeeding Tim Cook, who is now executive chair. Kevan Parekh is CFO.
What did Apple announce in September 2026? On September 9, Apple unveiled the iPhone Duo (its first foldable, from $1,999), the iPhone 18 Pro and Pro Max (from $1,199 and $1,299), Apple Watch Series 12 and Ultra 4, and AirPods 5, and set Siri AI’s beta rollout for September 14.
Does Siri use Google’s Gemini? Yes. Apple and Google confirmed in January 2026 a multi-year collaboration under which the next generation of Apple Foundation Models is based on Google’s Gemini models and cloud technology. Apple Intelligence still runs on Apple devices and Private Cloud Compute.
Why is Apple’s gross margin expected to fall? Apple guided the September quarter gross margin to 47% to 48%, down from 50.1% in June, mainly because of rising memory costs, partly offset by lower non-memory component costs and product mix. The June quarter also included a benefit of about two points from tariff refunds.
How is Apple doing in China? Better than in recent years. Greater China revenue was $18.8 billion in Q3 (up 22%), and $64.8 billion over nine months (up about 30%). IDC says Apple’s China share rose to 18.1% in Q2 2026, though Huawei leads at 22.6%.
Who are Apple’s biggest competitors? Samsung (22.7% global share in Q2 2026), Huawei (22.6% in China), Xiaomi, Google, and other Android makers, plus AI platforms competing to be users’ main assistant.
What lawsuits does Apple face? Apple faces a US Department of Justice antitrust suit, Epic Games’ App Store case (including a contempt ruling over commissions), and European Union Digital Markets Act investigations, all disclosed in its SEC filings.
When does Apple report next? Apple reports fiscal Q4 2026 results on Monday, November 2, 2026, with a call at 2:00 p.m. Pacific Time.
More Business Case Studies on Finmaticx
If this guide was useful, these related breakdowns on Finmaticx use the same data-first approach. You can also browse the full business case studies category.
- Nike Case Study: Business Model, Strategy and Revenue Breakdown: another global brand navigating a reset.
- Weightworld Case Study: UK to Pan-European D2C Empire: how a direct-to-consumer brand scaled across markets.
- ChatGPT Ads Case Study: How OpenAI Built a Billion-Dollar Ad Business in Months: AI as a revenue engine.
- How Does Shopify Make Money? 101 Revenue Breakdown: the platform economy.
- How Does Klarna Make Money? Full Business Model Explained (2026): buy now, pay later economics.
- How Does Zelle Make Money? The Full Business Model Explained (2026): free payments and who pays for them.
- How Does NerdWallet Make Money? 5 Revenue Streams Explained (2026): referral-fee economics.
- How Does Webull Make Money? Webull Business Model: what “zero commission” really means.
- How Does PhonePe Make Money?, How Does Meesho Make Money?, and How Does Zerodha Make Money?: three India-focused business models.
Want to know who writes this and why? Read What Is Finmaticx? Mission, Purpose and How It Helps Businesses, learn more about us, or explore Finmaticx AI’s free tools and our Ads GPT. Have a company you’d like us to analyze next? Contact us.
Sources and Methodology
Apple is a public company, so most figures here come directly from its SEC filings, earnings release, and earnings call. Where we calculated a figure ourselves (shares of revenue and gross profit, net cash, growth rates from reported figures, the tariff-refund estimate, underlying margin guidance), the text says so. Quotes and characterizations of management come from published transcripts and summaries. Market-share data comes from IDC and Counterpoint, whose methods differ. Analyst projections, such as Futurum’s foldable share estimate, are labeled as projections. The impact ratings in the summary table and the TOWS matrix are our judgments. Data was last checked on October 16, 2026. Apple’s fiscal Q4 results (November 2, 2026) had not yet been reported.
Apple filings and company sources
- Apple Q3 FY2026 earnings release (SEC)
- Apple Q3 FY2026 Form 10-Q (SEC) and Q2 FY2026 Form 10-Q (SEC)
- Apple FY2025 Form 10-K (SEC)
- CEO transition: Apple 8-K (SEC), 8-K/A (SEC), and Apple’s announcement
- Apple on SEC EDGAR
- Google and Apple joint statement
Earnings coverage and transcripts
- Q3 FY2026: Motley Fool transcript, Investing.com transcript summary, Yahoo Finance call highlights, VectorShift summary, CNBC live coverage, 9to5Mac, MacRumors, and Yahoo Finance
- Q2 FY2026 call (Yahoo Finance) and Apple Scoop: revenue by product
- MacRumors: Q4 earnings date
Products, AI, and regulation
- September 9 event: CNBC, ABC News, Variety, Fortune, Futurum, and The Gadgeteer
- Siri AI and Gemini: MacRumors and ITWire
- Epic and App Store: CNBC and TechCrunch
Market data