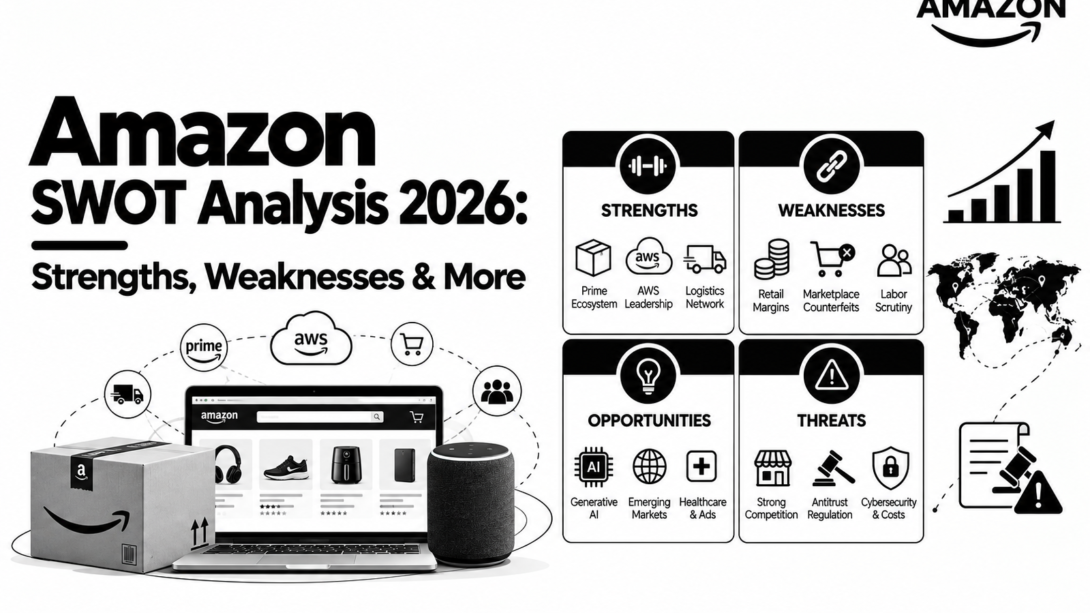
An Amazon SWOT analysis in October 2026 has to explain a puzzle. In the second quarter, Amazon reported net income of $62.6 billion, more than triple last year’s. Yet its free cash flow over the past twelve months was negative $7.6 billion. How can the same company be so profitable and so cash-hungry at once?
The answer is the story of Amazon today. Most of that profit jump, $53.4 billion of non-operating income, came from the rising value of Amazon’s investments in the AI company Anthropic. Underneath it, the core business had an excellent quarter: sales up 20% to $200.6 billion, operating income up 43% to $27.5 billion, and Amazon Web Services (AWS) growing 37%, its fastest pace in 18 quarters. But Amazon is also spending about $220 billion on capital projects in 2026, more than its operating cash flow, to build AI capacity it says customers have already reserved.
So is Amazon in a golden moment or a very expensive bet? This guide breaks down the Amazon SWOT analysis factor by factor, using the company’s SEC filings and earnings calls, plus the latest data on competitors, regulators, and the cloud market. Amazon reports its next results on October 29, so we also flag what to watch. Calculations we made ourselves are labeled as such.
Key Takeaways
- Strength: AWS reached a $169 billion annualized run rate with a $496 billion backlog, and by our calculation it produced about 60% of Amazon’s Q2 operating income on 21% of its revenue.
- Weakness: Free cash flow turned negative ($7.6 billion over the trailing twelve months) as capital spending outran operating cash flow, and headline net income was inflated by a one-time investment gain.
- Opportunity: Amazon is expanding in AI chips (Trainium), advertising ($19.8 billion in Q2), same-day grocery, satellites, and robotaxis.
- Threat: The FTC’s monopoly trial starts March 29, 2027, a new FTC advertising-auction lawsuit was filed August 31, and Google Cloud grew 82% in Q2 while AWS’s market share slipped to 28%.
- Watch: Amazon reports Q3 2026 results on Thursday, October 29, after the market close.
What Is a SWOT Analysis?
A SWOT analysis is a framework that sorts a company’s situation into four boxes: Strengths and Weaknesses (internal factors) and Opportunities and Threats (external factors). It helps students, investors, and managers see what a company does well, where it struggles, and what outside forces could help or hurt it.
In plain English: strengths and weaknesses are about Amazon itself; opportunities and threats are about the world around Amazon.
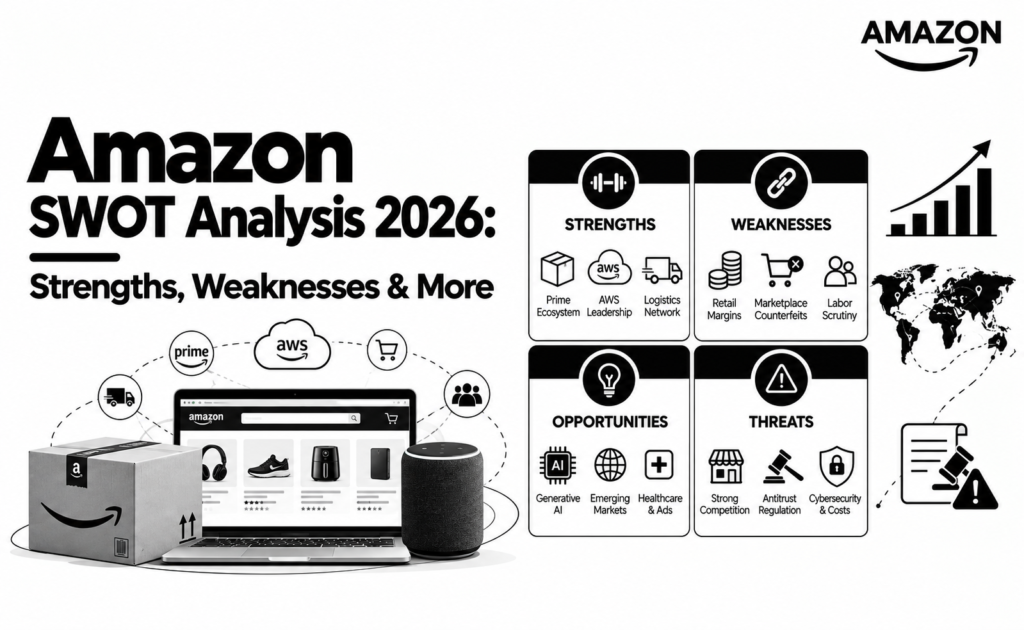
Amazon SWOT Analysis at a Glance
| Helpful | Harmful | |
|---|---|---|
| Internal | Strengths: AWS scale and acceleration; same-day logistics and Prime; advertising engine; custom chips and AI stack; ecosystem; operating leverage; AI lab partnerships | Weaknesses: negative free cash flow; profit concentrated in AWS; thin retail margins; earnings distorted by one-time items; capacity and cost constraints; workforce strain; entangled AI exposure |
| External | Opportunities: AI demand and backlog; selling Trainium chips; advertising growth; grocery and Amazon Now; Business and healthcare; Leo and Zoox; Alexa+ | Threats: Google Cloud and Azure; antitrust and consumer-protection cases; Walmart; AI overbuild risk; cost inflation; power constraints; labor and seller backlash |
Amazon Snapshot: Where the Company Stands in October 2026
| Metric | Figure | Source |
|---|---|---|
| FY2025 net sales; operating income; net income | $716.9 billion (+12%); $80.0 billion; $77.7 billion | Amazon Q4 2025 release |
| Q2 2026 net sales; operating income | $200.6 billion (+20%); $27.5 billion (+43%), a 13.7% margin | Amazon Q2 2026 release (SEC) |
| Q2 2026 AWS | $42.2 billion (+37%); operating income $16.6 billion (39.4% margin) | Amazon Q2 2026 release (SEC) |
| Q2 2026 net income | $62.6 billion, including $53.4 billion of non-operating income primarily from Anthropic investments | Amazon Q2 2026 release (SEC) |
| AWS backlog | $496 billion | Yahoo Finance call highlights |
| Advertising | $19.8 billion in Q2 (+26%); more than $68 billion in 2025 | Yahoo Finance, TechCrunch |
| 2026 capital spending | About $220 billion (raised from about $200 billion) | Yahoo Finance call highlights |
| Trailing-twelve-month free cash flow | Negative $7.6 billion | Amazon Q2 2026 release (SEC) |
| Q3 2026 guidance | Net sales $197 billion to $202 billion; operating income $22.5 billion to $26.5 billion | Investing.com transcript |
| Next earnings date | Thursday, October 29, 2026, after market close | CME Group |
Amazon SWOT Analysis: Strengths
S1. AWS: Scale, Acceleration, and a Huge Backlog
AWS is the heart of the Amazon SWOT analysis right now. Q2 2026 AWS sales were $42.2 billion, up 37%, with an annualized run rate of $169 billion, and operating income of $16.6 billion at a 39.4% margin. Growth has accelerated for five straight quarters, from 17% in Q2 2025 to 37%, according to TradingView’s summary of the release.
The backlog, contracted revenue not yet recognized, reached $496 billion, growing at triple-digit rates. At the end of 2025 it was $244 billion, so it roughly doubled in two quarters (our calculation). CEO Andy Jassy said most 2027 capacity is already reserved, with some 2028 capacity too, per the call summary.
The profit concentration is striking. In Q2, AWS produced about 60% of operating income on 21% of revenue (our calculation from the release). For all of 2025, AWS generated $45.6 billion of $80.0 billion in operating income, about 57%, on 18% of sales.
S2. A Logistics and Prime Machine Competitors Struggle to Match
Amazon’s retail edge is speed. In the first half of 2026, Amazon said it delivered over 40% more items same-day or overnight to Prime members, and Jassy’s April shareholder letter said its Same Day Fulfillment Centers had already delivered more than 500 million same-day units in 2026, per the Q2 release and shareholder letter.
The financial result: North America segment operating income rose to $9.1 billion from $7.5 billion in Q2 (up 21%), on $116.2 billion of sales, a margin of about 7.8% (our calculation). Part of the quarter’s growth came from Amazon moving Prime Day into June, so treat the 16% North America growth as flattered by timing.
S3. A Massive, Fast-Growing Advertising Business
Amazon’s advertising revenue was $19.8 billion in Q2 2026, up 26% year over year, and the company generated more than $68 billion in ad revenue in 2025, about 9.5% of its $716.9 billion in sales (our calculation). Management cited strong engagement with Prime Video ads and live sports, plus AI tools such as an Ads Agent that helps advertisers.
Advertising matters because it is high-margin revenue layered on top of retail traffic. Note, though, that regulators have now targeted this business (see Threat T2). To see how another AI company built an ad business from scratch, read our ChatGPT ads case study.
S4. Custom Silicon and a Full AI Stack
Amazon designs its own chips. On the Q2 call, Jassy said Amazon’s chips business, Trainium for AI and Graviton for general computing, exceeded a $25 billion annual run rate, and AWS’s AI business also exceeded $25 billion. Anthropic and OpenAI have both made multi-year, multi-gigawatt Trainium commitments, and Graviton is used by 98% of the top 1,000 EC2 customers, per the call summary.
On top of that, Amazon Bedrock offers models from many labs. The Q2 release lists 10-plus additions, including models from OpenAI, Anthropic, Google DeepMind, and others. Owning chips, cloud, and a model marketplace lets Amazon improve price-performance and keeps it neutral among AI labs.
S5. A Customer Ecosystem That Reinforces Itself
Amazon’s businesses feed each other. Per the Q2 release:
- Customers who use Alexa for shopping spend over 40% more per order, and customers who have tried Alexa+ sign up for Prime at nearly 25% higher rates.
- Amazon Business reached $60 billion in annualized gross sales.
- Prime Video’s series premiere of Off Campus drew 36 million viewers globally in 12 days.
- Amazon Pharmacy more than doubled its new customers in the first half, with same-day prescription deliveries up nearly five times.
Each product gives Prime members a reason to stay, and Prime gives each product an audience.
S6. Real Operating Leverage
Revenue grew 20% in Q2 while operating income grew 43%, and operating margin rose from 11.4% to 13.7%, a record. Trailing-twelve-month operating income reached $93.7 billion at a 12.1% margin, according to Levelheaded Investing’s analysis of the filings. AWS margin expanded about 650 basis points, driven by efficiency gains, capacity optimization, custom silicon, and fixed-cost management.
S7. Deep Partnerships With Both Leading AI Labs
Amazon has tied the two largest AI labs to its cloud:
- OpenAI (February 27, 2026): Amazon agreed to invest up to $50 billion, and OpenAI committed to spend $100 billion on AWS over eight years, expanding a $38 billion deal from November 2025, plus 2 gigawatts of Trainium capacity (CNBC).
- Anthropic (April 20, 2026): Amazon agreed to invest up to another $25 billion ($5 billion immediately, with up to $20 billion tied to milestones) on top of $8 billion previously invested, and Anthropic committed to spend more than $100 billion on AWS over ten years (CNBC).
These commitments help explain why AWS has the demand to justify its capacity build-out.
Amazon SWOT Analysis: Weaknesses
W1. Negative Free Cash Flow and Heavy Capital Intensity
Amazon’s free cash flow was an outflow of $7.6 billion over the trailing twelve months through June, driven by a $66.1 billion year-over-year increase in net purchases of property and equipment, mostly for AI (Amazon Q2 release). For comparison, free cash flow was $11.2 billion for all of 2025 and $38.2 billion for 2024.
The 2026 capital plan of about $220 billion equals roughly 136% of trailing operating cash flow ($161.4 billion) and about 28% of trailing revenue ($775.7 billion), both our calculations. Jassy argues the investment pays back: on the call he said servers and networking equipment take a little less than three years to break even, are useful for at least five to six years, and most AI capacity is contracted for at least five-year terms. That is a promise to monitor, not a result to assume.
W2. Profit Concentrated in One Segment
About 60% of operating income from 21% of revenue is both a strength and a weakness. If AWS growth stalls or margins fall, Amazon’s consolidated earnings feel it quickly. Meanwhile International operating income was just $1.7 billion on $42.2 billion of sales in Q2, a margin of about 4.0% (our calculation), and International profit fell 21% in Q4 2025 to $1.0 billion.
W3. Thin Margins Outside AWS
North America’s roughly 7.8% margin is solid for retail but modest next to AWS’s 39.4%. Management flagged rising memory chip prices and transportation costs, including fuel and linehaul rates, as pressures on margins, per the Yahoo Finance call highlights.
W4. Earnings Distorted by One-Time Items
Headline net income swings widely. Q2’s $62.6 billion included $53.4 billion of pre-tax non-operating income, primarily from Anthropic, and in the Q4 2025 quarter Amazon booked $2.4 billion of special charges, including $1.1 billion to resolve tax disputes, plus severance and store impairments (Levelheaded Investing). For all of 2025, a $15.2 billion non-operating equity gain contributed to record net income of $77.7 billion, per Beancount’s analysis.
This matters for anyone reading Amazon’s profit: operating income is the cleaner guide, and gains on investments can reverse if valuations fall.
W5. Capacity Constraints and Supply-Chain Dependence
Demand is outrunning supply. Management expects capacity constraints to persist into 2027 and targets doubling AWS’s 2025 power capacity by the end of 2027, per the BigGo call summary. The constraint isn’t just construction. It includes chips, memory, and power, and Jassy attributed cost pressure to the higher cost of memory, according to PrimeXBT’s earnings preview.
W6. Workforce Strain
Amazon cut about 30,000 corporate jobs in two rounds, 14,000 announced October 28, 2025 and 16,000 on January 28, 2026, the largest reduction in its history, roughly 9% to 10% of a corporate workforce of about 350,000. Smaller cuts followed in 2026, including a reported “fewer than 1,000” white-collar roles in its stores division in October, per Yahoo’s layoff tracker. Amazon says AI wasn’t the primary driver, but Jassy told staff in June 2025 that AI would likely reduce the corporate workforce over time.
Amazon’s total headcount was about 1.58 million at the end of 2025, mostly in operations. Rapid restructuring risks morale and institutional knowledge.
W7. Entangled Financial Exposure to AI Labs
Amazon is simultaneously an investor in, a supplier to, and a competitor of the AI labs it funds. Anthropic’s and OpenAI’s AWS commitments (more than $100 billion each over their terms) are huge relative to the $496 billion backlog. If both were counted in it, they’d be about 40% of the total (our arithmetic, $200 billion ÷ $496 billion), but Amazon hasn’t said how much of the backlog they represent, so treat that as an upper-bound illustration.
If either lab’s growth falters, Amazon would feel it in cloud demand and in the value of its stake.
Amazon SWOT Analysis: Opportunities
O1. Converting the Backlog Into Revenue
With $496 billion contracted, most 2027 capacity reserved, and some 2028 capacity reserved, Amazon’s opportunity is execution: building data centers, power, and chips fast enough to turn backlog into revenue. Jassy described demand as barbelled, with AI labs and runaway apps on one end, enterprise cost-avoidance on the other, and a large middle of production workloads still to move to the cloud.
O2. Selling Trainium Beyond AWS
Jassy said there is a real chance Amazon will sell Trainium chips to third-party data centers in the future, because customers have asked to buy them separate from the cloud. That would open a new revenue line and reduce dependence on Nvidia for the industry, though Amazon has not committed to it.
O3. Advertising Beyond Sponsored Products
Advertising grew 26% to $19.8 billion in Q2. Growth levers include Prime Video ads, live sports, and agent tools that help advertisers buy and optimize campaigns. Walmart’s advertising grew faster (38%), which shows both the size of the opportunity and the competition for it. If you run campaigns, Finmaticx’s Ads GPT can help you brainstorm angles for retail media.
O4. Grocery, Same-Day, and Ultra-Fast Delivery
On the Q2 call, Amazon said same-day perishable customers were up 50% since the start of the year and fresh groceries now make up six of the top 20 best sellers on Amazon.com. Same-day orders with perishables average over three times more units per order. Amazon Now, which delivers in 30 minutes or less, is in nine countries and more than 250 cities and towns, after adding 80 new US cities and towns in the quarter.
O5. Business, Pharmacy, and Healthcare
Amazon Business reached $60 billion in annualized gross sales. Amazon Pharmacy doubled new customers in the first half. Amazon also launched Health AI, which it says lets Prime members access up to five free virtual care visits. These businesses serve high-frequency, high-trust needs and strengthen Prime.
O6. Amazon Leo and Zoox
Two long-term bets are approaching revenue:
- Amazon Leo, the satellite network, has nearly 400 satellites in orbit, which Amazon says is enough to begin initial satellite internet service this year. Amazon has also announced a planned acquisition of Globalstar to add direct-to-device services, and said Leo will power satellite services for Apple iPhone and Apple Watch, per its Q1 2026 release. (Leo is late versus Starlink, which has more than 11,000 satellites in orbit, per HowToGeek.)
- Zoox, Amazon’s robotaxi unit, received federal approval (a NHTSA Part 555 exemption) to charge for rides, the first purpose-built robotaxi to receive it, paving the way for paid service.
O7. Alexa+ and AI-Driven Shopping
Alexa+ expanded to Germany, Austria, France, and Brazil, and Amazon says hundreds of millions of customers now use new Alexa experiences. If AI assistants become how people shop, Amazon owns the checkout, the logistics, and the device. Explore how AI assistants are changing marketing in our guide to Finmaticx GPT.
Amazon SWOT Analysis: Threats
T1. Google Cloud, Microsoft, and Share Loss in a Booming Market
The cloud market is growing fast, and AWS is growing more slowly than the market. Synergy Research Group reported worldwide cloud infrastructure spending of $143.4 billion in Q2 2026, up about 43%. AWS held 28% (down from about 30% a year earlier), Microsoft Azure 20%, and Google Cloud a record 15%, per Technology Checker’s summary and Shattered.io’s roundup.
By reported growth, AWS grew 37%, Azure 43%, and Google Cloud 82% (a $24.8 billion quarter). AWS is growing at its fastest in years and still losing share.
T2. Antitrust and Consumer-Protection Cases
Amazon faces several major legal fronts:
- FTC monopoly case: A bench trial is scheduled for March 29, 2027. A judge refused on October 9, 2026 to move it to June, according to PYMNTS.
- FTC advertising lawsuit (filed August 31, 2026): The FTC and 22 states allege Amazon secretly inflated prices in its ad auctions for more than seven years, affecting more than a million brands and sellers, with the FTC saying it likely extracted tens of billions of dollars (FTC). Amazon says the FTC “fundamentally misunderstands how advertisers operate” and that the average cost per click for sponsored product ads stayed flat adjusted for inflation from 2019 to 2024, per Stateline.
- De Coster class action: A jury trial over seller pricing rules is set for June 14, 2027.
- Prime settlement: Amazon’s $2.5 billion FTC settlement over Prime sign-ups and cancellations has been paying refunds, with automatic refunds continuing through April 2027, per Settlement Insight.
The advertising case is especially important because ads are one of Amazon’s most profitable growth lines, and the cases have already stirred seller frustration over rising ad costs, with some top merchants withholding ad spending in a boycott, per CNBC.
T3. Walmart and Other Retail Rivals
Walmart’s second quarter of fiscal 2027 (ended July 31, 2026) showed revenue up 5.9% to $187.9 billion, global e-commerce up 23%, global advertising up 38%, and membership fee revenue up 17%, according to Walmart’s release. CNBC reported Walmart has been gaining share among higher-income shoppers and building Walmart+, its Prime rival. In India, Amazon competes with marketplaces including Flipkart (Walmart-owned) and low-cost players like Meesho, whose economics we break down in how Meesho makes money.
T4. AI Overbuild and Return Risk
Spending about $220 billion in a year is a bet on sustained demand. If AI demand slows, customers renegotiate, or technology shifts make today’s servers less valuable, returns could fall short. A related risk is accounting: the Anthropic stake gain is a mark-to-market valuation, which could reverse. The value of the stake depends on Anthropic’s valuation, not on Amazon’s operations.
T5. Cost Inflation: Memory, Fuel, and Tariffs
Memory chip prices are rising across the industry, and Amazon cited memory, fuel, and linehaul rates as margin pressures. Q3 guidance of $22.5 billion to $26.5 billion in operating income is a wide range, reflecting that uncertainty. Walmart’s results also showed tariff refunds boosting gross margin, a reminder that trade policy affects retailers’ results in both directions.
T6. Power and Capacity Limits
Building AI capacity needs electricity and equipment that are in short supply. Amazon’s goal to double its power capacity by the end of 2027, and its statement that constraints will persist into 2027, shows how much growth depends on physical infrastructure, not just demand.
T7. Labor, Automation, and Reputation Risk
Amazon’s mass corporate layoffs, its automation push, and seller and advertiser frustration all carry reputational and regulatory risk. Jassy’s comments that AI will shrink corporate headcount draw scrutiny, and regulators are increasingly looking at how Amazon treats sellers and advertisers.
How Amazon Compares With Its Rivals
Cloud Infrastructure (Q2 2026)
| Metric | AWS (Amazon) | Microsoft Azure | Google Cloud |
|---|---|---|---|
| Market share (Synergy) | 28% (about 30% a year earlier) | 20% (flat) | 15% (record; 13% a year earlier) |
| Reported growth, Q2 2026 | 37% | 43% (Azure and other cloud services) | 82% |
| Quarterly revenue | $42.2 billion | Not broken out for Azure alone | $24.8 billion |
| Backlog | $496 billion | n/a | About $514 billion (reported) |
Sources: Amazon Q2 2026 release, Technology Checker, Shattered.io. Microsoft and Google figures come from secondary summaries of Synergy and company reports; the definitions differ across companies.
Retail and Advertising
| Metric | Amazon (Q2 2026) | Walmart (Q2 FY2027, quarter ended Jul 31) |
|---|---|---|
| Revenue growth | +20% (net sales, helped by Prime Day timing) | +5.9% |
| E-commerce growth | North America segment +16% | Global e-commerce +23% |
| Advertising growth | +26% to $19.8 billion | +38% (Walmart Connect +43% excluding VIZIO) |
| Membership | Prime (not disclosed) | Membership fee revenue +17% |
Sources: Amazon Q2 2026 release, Walmart Q2 FY2027 release, CNBC. The companies report different segments, so this is a momentum snapshot, not an exact comparison.
Two takeaways. First, Amazon is still far larger in both cloud and online retail, but its larger rivals are growing faster in specific areas. Second, the fastest growth anywhere in this table is in AI-related cloud demand and retail media, which is why both are under such intense scrutiny.
Amazon SWOT Analysis Summary Table (All 28 Factors)
The “Impact” column is our judgment of how much each factor matters to Amazon’s outlook over the next two years.
| # | Factor | Key Evidence | Impact |
|---|---|---|---|
| S1 | AWS scale and acceleration | $42.2B Q2 (+37%); $496B backlog | High |
| S2 | Logistics and Prime | 40%+ more same-day or overnight items; NA op income +21% | High |
| S3 | Advertising engine | $19.8B Q2 (+26%); $68B+ in 2025 | High |
| S4 | Custom silicon and AI stack | Chips and AI each above $25B run rate | High |
| S5 | Ecosystem flywheel | Alexa+ Prime sign-ups +25%; Business $60B | Medium |
| S6 | Operating leverage | Op income +43% on sales +20% | Medium |
| S7 | AI lab partnerships | OpenAI and Anthropic $100B+ AWS commitments | High |
| W1 | Negative free cash flow | TTM FCF −$7.6B; capex about $220B | High |
| W2 | Profit concentration | AWS about 60% of Q2 operating income (our calc) | High |
| W3 | Thin retail and international margins | NA about 7.8%; International about 4.0% (our calc) | Medium |
| W4 | One-time items in earnings | $53.4B non-operating gain in Q2 | Medium |
| W5 | Capacity and supply constraints | Constraints through 2027 | High |
| W6 | Workforce strain | About 30,000 corporate cuts | Medium |
| W7 | Entangled AI exposure | Investor, supplier, and rival to labs | Medium |
| O1 | Backlog conversion | 2027 capacity largely reserved | High |
| O2 | Selling Trainium externally | “Real chance” per Jassy | Medium |
| O3 | Advertising expansion | Prime Video ads, Ads Agent | High |
| O4 | Grocery, same-day, Amazon Now | Perishables customers +50% | Medium |
| O5 | Business, Pharmacy, healthcare | Business $60B; Pharmacy new customers 2x | Medium |
| O6 | Leo and Zoox | About 400 satellites; Zoox paid-ride exemption | Low |
| O7 | Alexa+ and AI shopping | Expanded to 4 more countries | Medium |
| T1 | Cloud rivals and share loss | AWS 28%; Google Cloud +82% | High |
| T2 | Antitrust and consumer cases | FTC trial Mar 29, 2027; ad suit Aug 31, 2026 | High |
| T3 | Walmart and retail rivals | Walmart e-commerce +23%; ads +38% | Medium |
| T4 | AI overbuild and valuation risk | Mark-to-market gains can reverse | High |
| T5 | Cost inflation | Memory, fuel, linehaul | Medium |
| T6 | Power and capacity limits | Doubling power by end 2027 | Medium |
| T7 | Labor, automation, reputation | Layoffs; seller and advertiser frustration | Medium |
Turning the Amazon SWOT Analysis Into Action (TOWS)
A TOWS matrix pairs the four boxes to suggest strategies. This table is our analysis, not Amazon’s plan.
| Opportunities | Threats | |
|---|---|---|
| Strengths | SO (use strengths to seize opportunities): Use the AWS backlog, custom chips, and lab partnerships to lock in AI workloads, while using Prime and logistics to scale grocery and healthcare | ST (use strengths to blunt threats): Use AWS margins and cash flow to out-invest Google and Microsoft on capacity, and use advertising transparency to defuse regulators |
| Weaknesses | WO (fix weaknesses by grasping opportunities): Offset negative free cash flow by monetizing Trainium externally and growing higher-margin ads and services | WT (minimize weaknesses and avoid threats): Reduce dependence on a few AI customers and on mark-to-market gains, and settle or reform ad practices before the 2027 trials |
What to Watch Next
- October 29, 2026: Q3 results. Guidance is for net sales of $197 billion to $202 billion (up 9% to 12%) and operating income of $22.5 billion to $26.5 billion. The Prime Day shift into June reduces Q3 growth by about 400 basis points, according to the call summary, and currency is a roughly 80-basis-point headwind.
- AWS growth and margin: Does growth stay near 37% as capacity comes online, and does margin hold near 39%?
- Capital spending and free cash flow: Whether the $220 billion plan holds, and how the free-cash-flow gap evolves.
- Anthropic stake: Further mark-to-market gains or losses will move net income, so focus on operating income.
- Legal calendar: The FTC monopoly trial (March 29, 2027) and ad-auction case, and the De Coster jury trial (June 14, 2027).
- Trainium and Leo: Any decision to sell chips externally, and the start of Leo service.
How to Use This Amazon SWOT Analysis
For students: Pick three factors from each box, attach a number to each, and show how they interact. For example, AWS’s profits (S1) fund the capex (W1), which depends on AI customers (W7). A strong answer shows the connections.
For investors: Treat the SWOT as a checklist, not a verdict. Focus on operating income and operating cash flow, and watch whether backlog converts to revenue faster than capex grows.
For marketers and sellers: Amazon’s advertising and marketplace economics affect anyone who sells on the platform. Finmaticx’s AI tools hub, Ads GPT, and free AI prompt generator can help you plan and test campaigns.
Limits of SWOT: The framework is a snapshot. It doesn’t weigh factors against each other or predict outcomes, and the same fact can be a strength or a weakness (AWS’s profit share is both). That’s why we added impact ratings and the TOWS table.
Case Study Discussion Questions
- AWS produces about 60% of operating income on 21% of revenue. Is Amazon better understood as a cloud company with a retail business, or the reverse?
- Amazon plans to spend about $220 billion in 2026, more than its operating cash flow. What evidence would convince you that the investment will pay off?
- Net income of $62.6 billion included a $53.4 billion gain on an investment. How should investors and analysts treat gains like this when judging a company’s performance?
- Amazon invests in, supplies, and competes with the AI labs that are its biggest cloud customers. What are the benefits and risks of that structure?
- The FTC says Amazon’s ad auctions secretly raised prices, and Amazon says its cost per click stayed flat. Which evidence would settle the question?
- Walmart is growing e-commerce and advertising faster than Amazon. How should Amazon respond without sacrificing margins?
To structure your answers, try Finmaticx GPT.
Amazon SWOT Analysis FAQ
What is Amazon’s SWOT analysis? Amazon’s SWOT analysis sorts its internal strengths and weaknesses and external opportunities and threats. In 2026, strengths include AWS and Prime logistics; weaknesses include negative free cash flow and profit concentration; opportunities include AI demand, advertising, and grocery; threats include Google Cloud, antitrust cases, Walmart, and cost inflation.
What are Amazon’s biggest strengths? AWS (a $169 billion run rate with a $496 billion backlog), a fast logistics and Prime network, a $68-billion-plus advertising business, custom AI chips, and a self-reinforcing ecosystem.
What are Amazon’s biggest weaknesses? Negative trailing free cash flow (−$7.6 billion) because of heavy capital spending, profit concentrated in AWS, thin retail and international margins, earnings distorted by investment gains, and capacity and cost constraints.
What opportunities does Amazon have? Converting its AWS backlog into revenue, possibly selling Trainium chips externally, growing advertising, expanding grocery and ultra-fast delivery, scaling Amazon Business and healthcare, and launching Amazon Leo and Zoox services.
What are the main threats to Amazon? Fast-growing cloud rivals (Google Cloud grew 82% in Q2), antitrust and advertising lawsuits, Walmart’s e-commerce and ad growth, the risk that AI spending outruns demand, and rising memory, fuel, and transport costs.
How much revenue does Amazon make? Amazon’s 2025 net sales were $716.9 billion, up 12%, with operating income of $80.0 billion. In Q2 2026, net sales were $200.6 billion, up 20%.
How much profit does AWS make? AWS had operating income of $16.6 billion in Q2 2026 on sales of $42.2 billion, a 39.4% margin. For 2025, AWS operating income was $45.6 billion on $128.7 billion of sales.
Why was Amazon’s Q2 2026 net income so high? Net income was $62.6 billion because it included $53.4 billion of pre-tax non-operating income, primarily from Amazon’s investments in Anthropic. Operating income, a cleaner measure of the core business, was $27.5 billion.
How much is Amazon spending on AI and data centers? Management raised 2026 capital spending guidance to about $220 billion, mostly for AI and cloud infrastructure. Cash capex was $53.1 billion in Q2 alone.
What lawsuits does Amazon face? The FTC’s monopoly case (trial March 29, 2027), a separate FTC and 22-state lawsuit over advertising auction pricing (filed August 31, 2026), the De Coster class action (jury trial June 14, 2027), and the ongoing payout of a $2.5 billion FTC Prime settlement.
Who are Amazon’s biggest competitors? In cloud, Microsoft Azure and Google Cloud. In retail and advertising, Walmart, and in India, Flipkart and Meesho, among others.
How much has Amazon invested in Anthropic and OpenAI? Amazon previously invested $8 billion in Anthropic and, in April 2026, agreed to invest up to $25 billion more ($5 billion upfront, up to $20 billion tied to milestones). In February 2026 it agreed to invest up to $50 billion in OpenAI. Both labs committed to spend more than $100 billion on AWS.
Who is Amazon’s CEO? Andy Jassy is President and CEO.
When does Amazon report next? Amazon reports Q3 2026 results on Thursday, October 29, 2026, after the market close, with a call at 5:00 p.m. Eastern Time.
More Business Case Studies on Finmaticx
If this guide was useful, these related breakdowns on Finmaticx use the same data-first approach. You can also browse the full business case studies category.
- Nike Case Study: Business Model, Strategy and Revenue Breakdown: a global brand navigating a reset.
- Weightworld Case Study: UK to Pan-European D2C Empire: how a direct-to-consumer brand scaled across markets.
- ChatGPT Ads Case Study: How OpenAI Built a Billion-Dollar Ad Business in Months: AI as an ad platform.
- How Does Shopify Make Money? 101 Revenue Breakdown: the platform behind many Amazon alternatives.
- How Does Klarna Make Money? Full Business Model Explained (2026): buy now, pay later economics.
- How Does Zelle Make Money? The Full Business Model Explained (2026): free payments and who pays for them.
- How Does NerdWallet Make Money? 5 Revenue Streams Explained (2026): referral-fee economics.
- How Does Webull Make Money? Webull Business Model: what “zero commission” really means.
- How Does PhonePe Make Money?, How Does Meesho Make Money?, and How Does Zerodha Make Money?: three India-focused business models.
Want to know who writes this and why? Read What Is Finmaticx? Mission, Purpose and How It Helps Businesses, learn more about us, or explore Finmaticx AI’s free tools. Have a company you’d like us to analyze next? Contact us.
Sources and Methodology
Amazon is a public company, so most figures here come directly from its SEC filings, earnings releases, shareholder letters, and earnings calls. Where we calculated a figure ourselves (segment shares of revenue and operating income, margins, capex ratios, advertising as a share of sales, backlog growth), the text says so. Characterizations of management comments come from published transcripts and call summaries. Cloud market-share and growth figures for Microsoft and Google come from secondary summaries of Synergy Research Group and company reports, and definitions differ across companies. Legal developments come from the FTC, court-schedule reporting by MLex and PYMNTS, and news coverage. The impact ratings in the summary table and the TOWS matrix are our judgments. Data was last checked on October 22, 2026. Amazon’s Q3 2026 results (October 29, 2026) had not yet been reported.
Disclosure: This article was drafted with help from Claude, an AI model made by Anthropic. Anthropic is also a company Amazon has invested in and that this article discusses. To avoid any bias, we limited Anthropic-related statements to figures from Amazon’s own filings and major news outlets, and we present the investment gain as the one-time accounting item it is.
Amazon filings and company sources
- Amazon Q2 2026 earnings release (SEC), Amazon’s Q2 2026 results page, and Q2 2026 release (PDF)
- Amazon Q4 2025 earnings release and Q1 2026 release (SEC)
- Amazon shareholder letter (SEC) and proxy statement (SEC)
Earnings coverage and analysis
- Q2 2026 call: Yahoo Finance transcript, Investing.com transcript, Yahoo Finance call highlights, VectorShift summary, and BigGo summary
- Yahoo Finance: Q2 2026 results, TradingView, Levelheaded Investing: Q2 2026, and Levelheaded Investing: Q4 2025
- Beancount: FY2025 analysis and PrimeXBT: earnings date and guidance
- CME Group: Amazon earnings date
AI partnerships and markets
- CNBC: Amazon and OpenAI (February 27, 2026) and CNBC: Amazon and Anthropic (April 20, 2026)
- Cloud market: Technology Checker: AWS, Technology Checker: Google Cloud, and Shattered.io
- Amazon Leo: HowToGeek
Regulation, labor, and competitors